


Stop Defaulting to Accuracy: The 7-Day Precision-Recall Audit
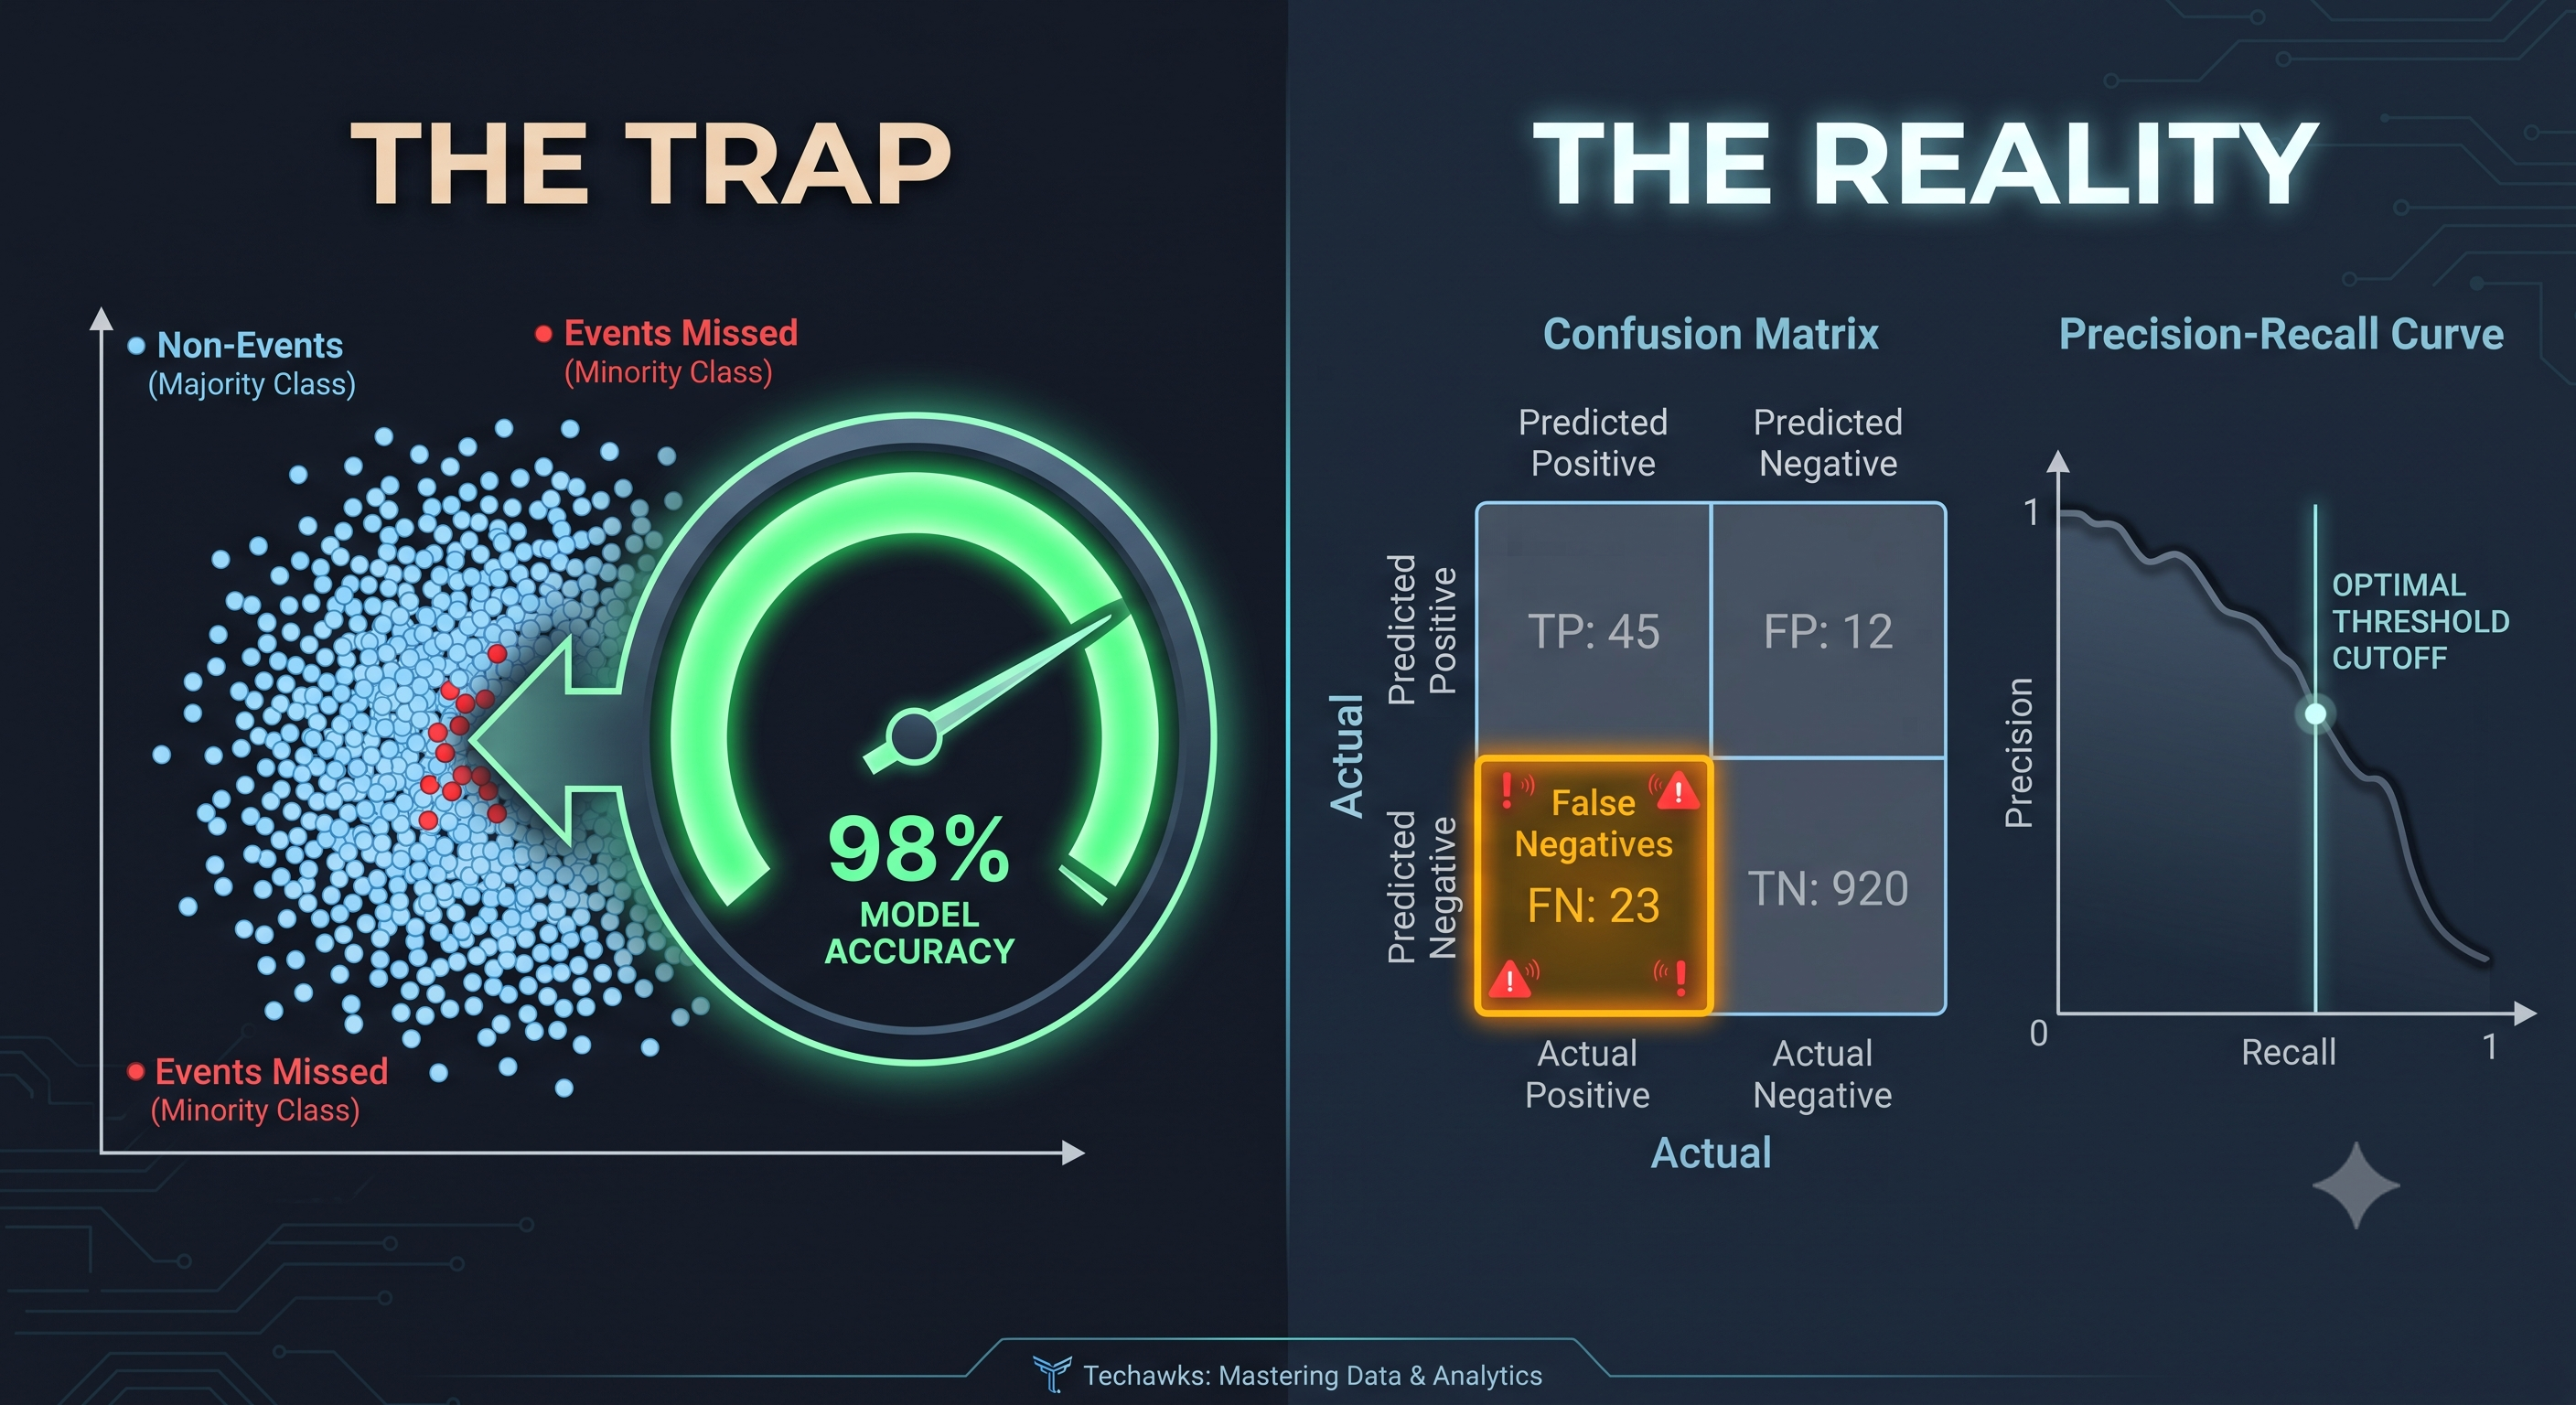
High overall accuracy is often the easiest metric to achieve and the quickest way to fail in production. When 99% of your transactions are legitimate and 1% are fraudulent, a model that predicts "legitimate" every single time will report 99% accuracy while catching zero fraud.
Evaluating models using the wrong aggregate metrics obscures critical blind spots:
The Asymmetry of Error: A false positive (flagging a valid transaction) causes minor customer friction. A false negative (missing actual fraud) causes direct financial loss. Standard accuracy treats both outcomes as identical.
Class Imbalance Masking: High-frequency classes overwhelm minority classes in loss functions, rewarding algorithms that simply guess the majority label.
Probability Miscalibration: Relying strictly on default 0.5 classification thresholds ignores the trade-off curve between precision (how many flagged items were truly positive) and recall (how many actual positives were found).
The 7-Day Precision-Recall Challenge:
Pick one production or development classification model currently evaluated on aggregate accuracy and run this audit:
Step 1: Compute the Confusion Matrix. Separate your validation outcomes into True Positives, False Positives, True Negatives, and False Negatives. Identify your single most expensive error type.
Step 2: Plot the PR (Precision-Recall) Curve. Move away from ROC-AUC when positive class prevalence is low (under 10%). A PR curve reveals model degradation that ROC curves hide.
Step 3: Shift the Decision Threshold. Move your threshold off the default 0.5. Measure the impact on both precision and recall. Find the operational cutoff that minimizes expected business cost rather than maximizing raw hits.
Step 4: Establish a New Primary Metric. Re-evaluate model iterations against F-beta (weighting recall over precision, or vice versa) or PR-AUC rather than raw accuracy.
Key Takeaways
Accuracy hides imbalance: High accuracy on rare-event detection usually means the model has learned to ignore the event entirely.
ROC-AUC flatters; PR-AUC clarifies: In skewed datasets, use Precision-Recall curves to get a realistic picture of positive-class performance.
Thresholds are business decisions: A 0.5 probability cutoff is an arbitrary default. Set classification boundaries based on the real-world cost of false positives versus false negatives.
CTA
Ready to move beyond textbook metrics and build production-grade analytical models? Join the Data Science & Analytics community to collaborate on real-world workflows, architecture, and deployment strategies.
High overall accuracy is often the easiest metric to achieve and the quickest way to fail in production. When 99% of your transactions are legitimate and 1% are fraudulent, a model that predicts "legitimate" every single time will report 99% accuracy while catching zero fraud.
Evaluating models using the wrong aggregate metrics obscures critical blind spots:
The Asymmetry of Error: A false positive (flagging a valid transaction) causes minor customer friction. A false negative (missing actual fraud) causes direct financial loss. Standard accuracy treats both outcomes as identical.
Class Imbalance Masking: High-frequency classes overwhelm minority classes in loss functions, rewarding algorithms that simply guess the majority label.
Probability Miscalibration: Relying strictly on default 0.5 classification thresholds ignores the trade-off curve between precision (how many flagged items were truly positive) and recall (how many actual positives were found).
The 7-Day Precision-Recall Challenge:
Pick one production or development classification model currently evaluated on aggregate accuracy and run this audit:
Step 1: Compute the Confusion Matrix. Separate your validation outcomes into True Positives, False Positives, True Negatives, and False Negatives. Identify your single most expensive error type.
Step 2: Plot the PR (Precision-Recall) Curve. Move away from ROC-AUC when positive class prevalence is low (under 10%). A PR curve reveals model degradation that ROC curves hide.
Step 3: Shift the Decision Threshold. Move your threshold off the default 0.5. Measure the impact on both precision and recall. Find the operational cutoff that minimizes expected business cost rather than maximizing raw hits.
Step 4: Establish a New Primary Metric. Re-evaluate model iterations against F-beta (weighting recall over precision, or vice versa) or PR-AUC rather than raw accuracy.
Key Takeaways
Accuracy hides imbalance: High accuracy on rare-event detection usually means the model has learned to ignore the event entirely.
ROC-AUC flatters; PR-AUC clarifies: In skewed datasets, use Precision-Recall curves to get a realistic picture of positive-class performance.
Thresholds are business decisions: A 0.5 probability cutoff is an arbitrary default. Set classification boundaries based on the real-world cost of false positives versus false negatives.
CTA
Ready to move beyond textbook metrics and build production-grade analytical models? Join the Data Science & Analytics community to collaborate on real-world workflows, architecture, and deployment strategies.
Stop Defaulting to Accuracy: The 7-Day Precision-Recall Audit
High overall accuracy is often the easiest metric to achieve and the quickest way to fail in production. When 99% of your transactions are legitimate and 1% are fraudulent, a model that predicts "legitimate" every single time will report 99% accuracy while catching zero fraud.
Evaluating models using the wrong aggregate metrics obscures critical blind spots:
The Asymmetry of Error: A false positive (flagging a valid transaction) causes minor customer friction. A false negative (missing actual fraud) causes direct financial loss. Standard accuracy treats both outcomes as identical.
Class Imbalance Masking: High-frequency classes overwhelm minority classes in loss functions, rewarding algorithms that simply guess the majority label.
Probability Miscalibration: Relying strictly on default 0.5 classification thresholds ignores the trade-off curve between precision (how many flagged items were truly positive) and recall (how many actual positives were found).
The 7-Day Precision-Recall Challenge:
Pick one production or development classification model currently evaluated on aggregate accuracy and run this audit:
Step 1: Compute the Confusion Matrix. Separate your validation outcomes into True Positives, False Positives, True Negatives, and False Negatives. Identify your single most expensive error type.
Step 2: Plot the PR (Precision-Recall) Curve. Move away from ROC-AUC when positive class prevalence is low (under 10%). A PR curve reveals model degradation that ROC curves hide.
Step 3: Shift the Decision Threshold. Move your threshold off the default 0.5. Measure the impact on both precision and recall. Find the operational cutoff that minimizes expected business cost rather than maximizing raw hits.
Step 4: Establish a New Primary Metric. Re-evaluate model iterations against F-beta (weighting recall over precision, or vice versa) or PR-AUC rather than raw accuracy.
Key Takeaways
Accuracy hides imbalance: High accuracy on rare-event detection usually means the model has learned to ignore the event entirely.
ROC-AUC flatters; PR-AUC clarifies: In skewed datasets, use Precision-Recall curves to get a realistic picture of positive-class performance.
Thresholds are business decisions: A 0.5 probability cutoff is an arbitrary default. Set classification boundaries based on the real-world cost of false positives versus false negatives.
CTA
Ready to move beyond textbook metrics and build production-grade analytical models? Join the Data Science & Analytics community to collaborate on real-world workflows, architecture, and deployment strategies.

 Arabic
 French
 Spanish
 Portuguese
 Deutsch
 Turkish
 Dutch
Dutch
 Italiano
 Russian
 Romaian
 Portuguese (Brazil)
 Greek
Greek