


The Death of Dashboard Sprawl: Why the Semantic Layer is the Most Critical Asset in Modern Analytics
Data analytics has moved far past the era of building endless, static visualization dashboards. In modern data architecture, the primary bottleneck is no longer querying raw data or loading tables into a cloud warehouse. The real friction lies in metric fragmentation—where every business intelligence tool, team, and department calculates critical key performance indicators using slightly different SQL queries.
Why It Matters
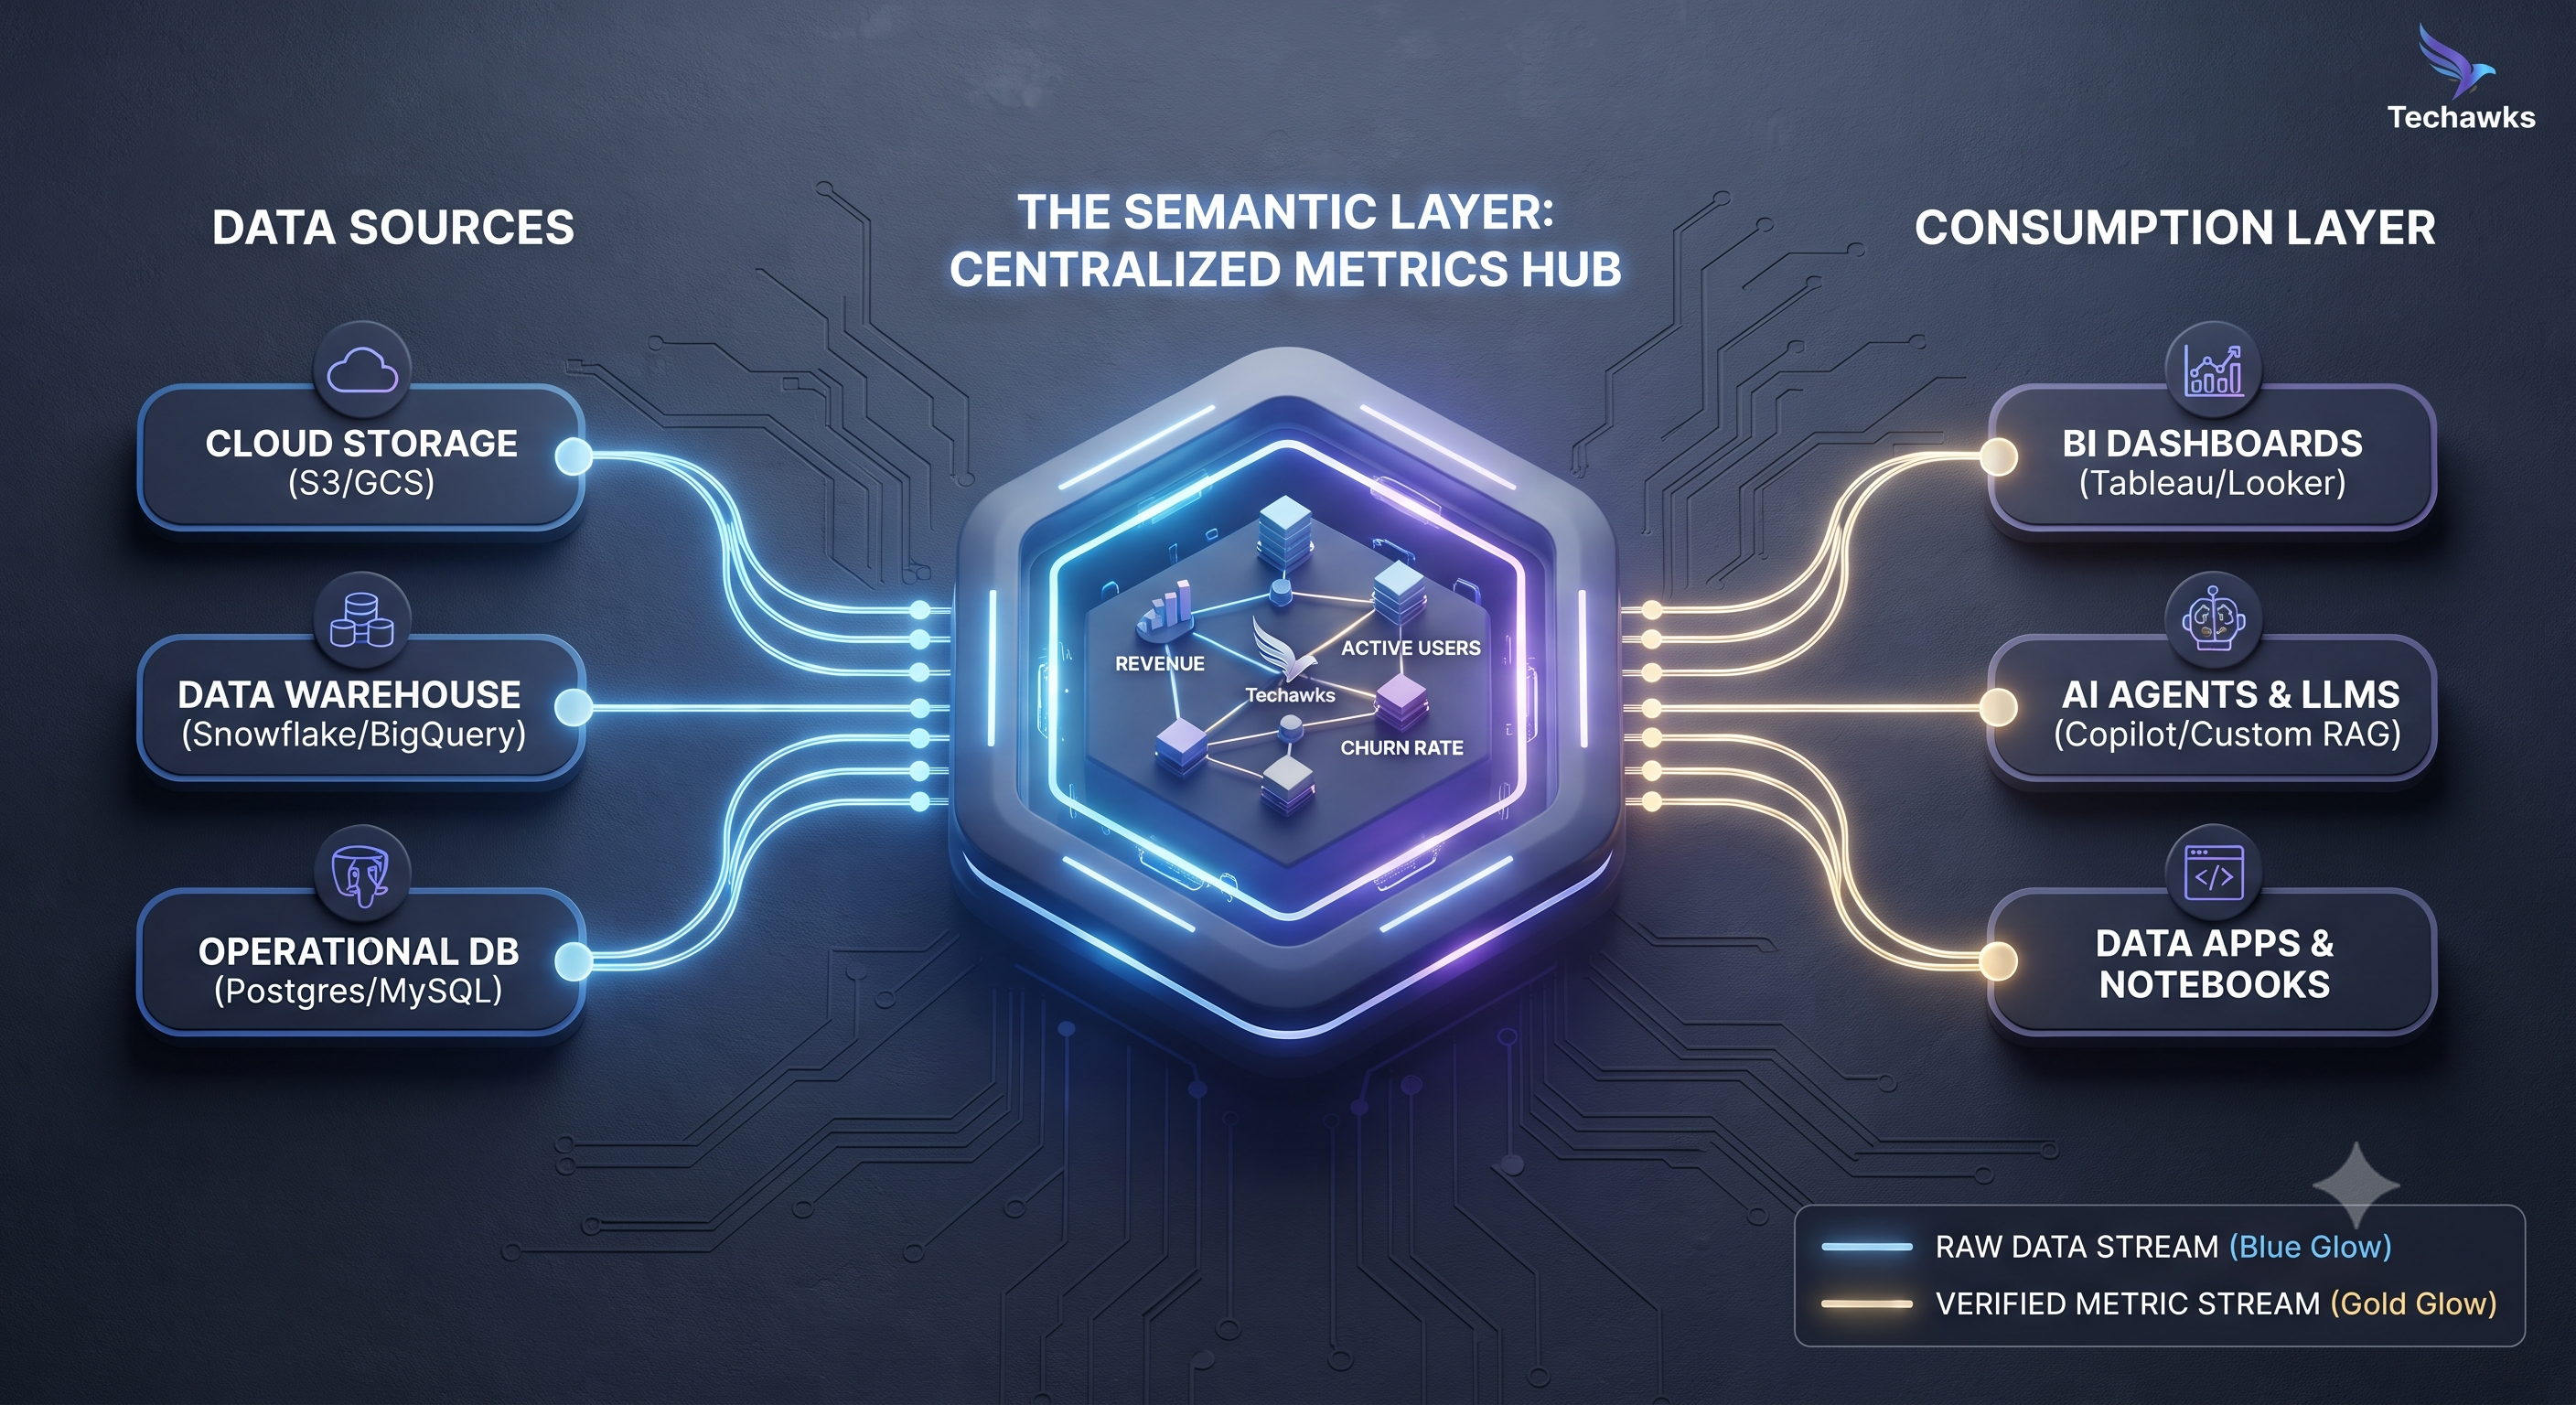
When organizations fail to centralize their business definitions, self-service analytics breaks down. Worse yet, as teams begin integrating large language models and autonomous AI agents to query enterprise data, an unmanaged semantic layer leads to confident, AI-generated hallucinations. If "revenue" or "active user" isn't defined precisely once, your reporting and AI systems will scale misinformation faster than ever.
What You Need to Know (The Analytics Playbook)
To build a trusted, scalable analytics stack and eliminate dashboard discrepancies, implement these three core practices:
Decouple Logic from Presentation: Move away from writing business logic directly inside BI tool charts. Use semantic layer tools or metrics-as-code frameworks (such as dbt semantic models or Cube) to define dimensions and measures in a single source of truth.
Treat Metrics Like Software Code: Version-control your business definitions, require code reviews for metric updates, and attach automated data quality tests for uniqueness and null checks from day one.
Govern for Human and AI Consumption: Ensure that whether a human analyst queries a report or an AI agent calls a database function, both pull from the exact same governed metric definitions.
Discussion Question
How does your team handle metric alignment across departments? Have you adopted a centralized semantic layer, or are you still battling conflicting numbers in dashboard tools? Let's discuss below! 👇
CTA (Join Data Science & Analytics)
Want to master modern data architecture, semantic modeling, and scalable analytics workflows? Join Data Science & Analytics today to connect with data professionals and elevate your technical expertise!
Data analytics has moved far past the era of building endless, static visualization dashboards. In modern data architecture, the primary bottleneck is no longer querying raw data or loading tables into a cloud warehouse. The real friction lies in metric fragmentation—where every business intelligence tool, team, and department calculates critical key performance indicators using slightly different SQL queries.
Why It Matters
When organizations fail to centralize their business definitions, self-service analytics breaks down. Worse yet, as teams begin integrating large language models and autonomous AI agents to query enterprise data, an unmanaged semantic layer leads to confident, AI-generated hallucinations. If "revenue" or "active user" isn't defined precisely once, your reporting and AI systems will scale misinformation faster than ever.
What You Need to Know (The Analytics Playbook)
To build a trusted, scalable analytics stack and eliminate dashboard discrepancies, implement these three core practices:
Decouple Logic from Presentation: Move away from writing business logic directly inside BI tool charts. Use semantic layer tools or metrics-as-code frameworks (such as dbt semantic models or Cube) to define dimensions and measures in a single source of truth.
Treat Metrics Like Software Code: Version-control your business definitions, require code reviews for metric updates, and attach automated data quality tests for uniqueness and null checks from day one.
Govern for Human and AI Consumption: Ensure that whether a human analyst queries a report or an AI agent calls a database function, both pull from the exact same governed metric definitions.
Discussion Question
How does your team handle metric alignment across departments? Have you adopted a centralized semantic layer, or are you still battling conflicting numbers in dashboard tools? Let's discuss below! 👇
CTA (Join Data Science & Analytics)
Want to master modern data architecture, semantic modeling, and scalable analytics workflows? Join Data Science & Analytics today to connect with data professionals and elevate your technical expertise!
The Death of Dashboard Sprawl: Why the Semantic Layer is the Most Critical Asset in Modern Analytics
Data analytics has moved far past the era of building endless, static visualization dashboards. In modern data architecture, the primary bottleneck is no longer querying raw data or loading tables into a cloud warehouse. The real friction lies in metric fragmentation—where every business intelligence tool, team, and department calculates critical key performance indicators using slightly different SQL queries.
Why It Matters
When organizations fail to centralize their business definitions, self-service analytics breaks down. Worse yet, as teams begin integrating large language models and autonomous AI agents to query enterprise data, an unmanaged semantic layer leads to confident, AI-generated hallucinations. If "revenue" or "active user" isn't defined precisely once, your reporting and AI systems will scale misinformation faster than ever.
What You Need to Know (The Analytics Playbook)
To build a trusted, scalable analytics stack and eliminate dashboard discrepancies, implement these three core practices:
Decouple Logic from Presentation: Move away from writing business logic directly inside BI tool charts. Use semantic layer tools or metrics-as-code frameworks (such as dbt semantic models or Cube) to define dimensions and measures in a single source of truth.
Treat Metrics Like Software Code: Version-control your business definitions, require code reviews for metric updates, and attach automated data quality tests for uniqueness and null checks from day one.
Govern for Human and AI Consumption: Ensure that whether a human analyst queries a report or an AI agent calls a database function, both pull from the exact same governed metric definitions.
Discussion Question
How does your team handle metric alignment across departments? Have you adopted a centralized semantic layer, or are you still battling conflicting numbers in dashboard tools? Let's discuss below! 👇
CTA (Join Data Science & Analytics)
Want to master modern data architecture, semantic modeling, and scalable analytics workflows? Join Data Science & Analytics today to connect with data professionals and elevate your technical expertise!

 English
 Arabic
 Spanish
 Portuguese
 Deutsch
 Turkish
 Dutch
Dutch
 Italiano
 Russian
 Romaian
 Portuguese (Brazil)
 Greek
Greek