


The Metric Drift Illusion: Why Your Dashboards Agree on Nothing and Your AI is Lying
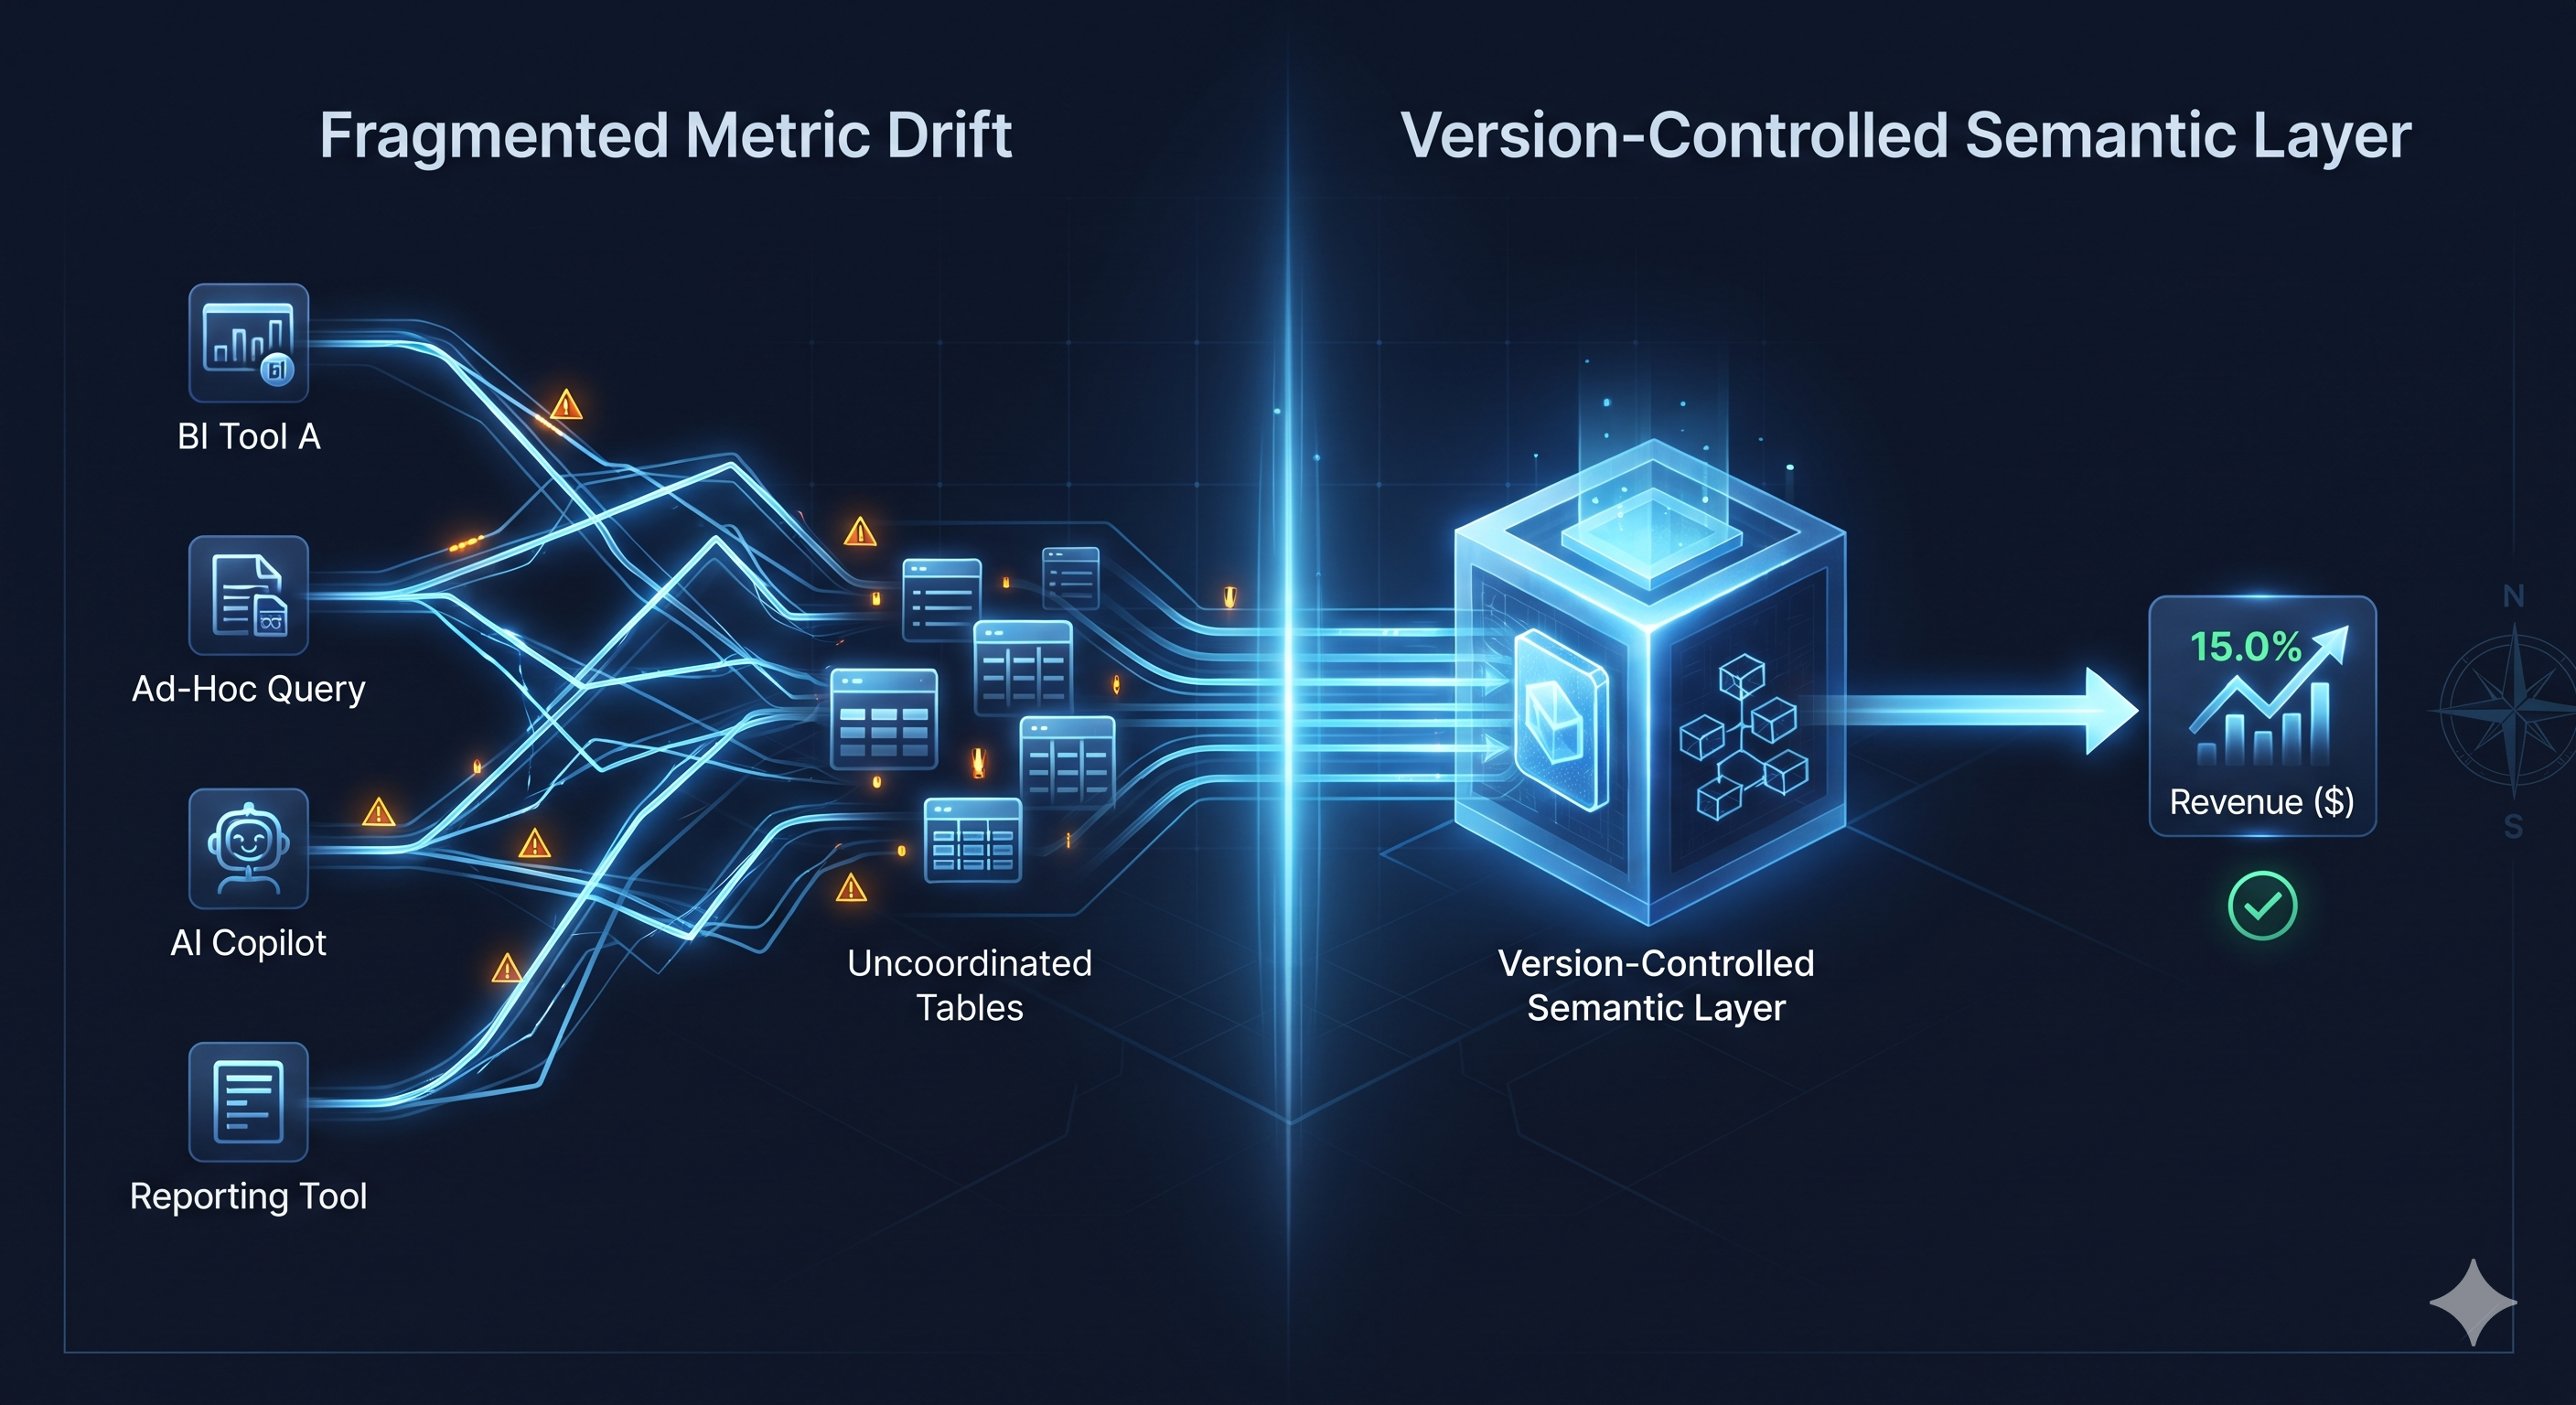
With modern data architectures shifting toward decentralized domains, semantic layers, and automated AI consumption, data teams face a structural crisis. When every department calculates core metrics independently across disconnected dbt models, looker views, or ad-hoc SQL scripts, you don't have a data-driven culture—you have an organized guessing game.
Why It Matters
Traditional reporting treated metrics as UI-level logic inside individual dashboards. When business users or LLM agents query a data warehouse directly, they don't see those dashboard filters or hidden business rules. If your business definitions live inside fragmented tools rather than a centralized governed layer, AI agents will hallucinate metrics, executives will argue over spreadsheet discrepancies in board meetings, and trust in analytics will evaporate.
What You Need to Know: Engineering a Single Source of Truth
To eliminate metric drift and make your data stack AI-ready, data professionals must implement rigorous semantic governance:
Centralize Metric Definitions as Code: Move away from dashboard-locked formulas. Define business-critical metrics (like ARR, churn, or net retention) once in code using version-controlled semantic layers or transformation tools.
Enforce Grain and Join Boundaries: Clearly document and lock down table grains and foreign-key join paths. Prevent users and AI tools from carelessly performing many-to-many joins that result in silent double-counting and fanouts.
Expose Governed Context to AI Layers: Never plug an LLM directly into raw, unmapped database schemas. Feed AI tools structured metadata and semantic definitions so natural language queries resolve to the exact same governed SQL every single time.
Discussion Question
How does your team currently handle metric definitions? Are you using a centralized semantic layer, or do different departments still maintain their own independent dashboard formulas?
CTA (Join Data Science & Analytics)
Want to master advanced data modeling, semantic architecture, and modern analytics engineering patterns? Join Data Science & Analytics to connect with global data professionals building reliable, scalable systems.
With modern data architectures shifting toward decentralized domains, semantic layers, and automated AI consumption, data teams face a structural crisis. When every department calculates core metrics independently across disconnected dbt models, looker views, or ad-hoc SQL scripts, you don't have a data-driven culture—you have an organized guessing game.
Why It Matters
Traditional reporting treated metrics as UI-level logic inside individual dashboards. When business users or LLM agents query a data warehouse directly, they don't see those dashboard filters or hidden business rules. If your business definitions live inside fragmented tools rather than a centralized governed layer, AI agents will hallucinate metrics, executives will argue over spreadsheet discrepancies in board meetings, and trust in analytics will evaporate.
What You Need to Know: Engineering a Single Source of Truth
To eliminate metric drift and make your data stack AI-ready, data professionals must implement rigorous semantic governance:
Centralize Metric Definitions as Code: Move away from dashboard-locked formulas. Define business-critical metrics (like ARR, churn, or net retention) once in code using version-controlled semantic layers or transformation tools.
Enforce Grain and Join Boundaries: Clearly document and lock down table grains and foreign-key join paths. Prevent users and AI tools from carelessly performing many-to-many joins that result in silent double-counting and fanouts.
Expose Governed Context to AI Layers: Never plug an LLM directly into raw, unmapped database schemas. Feed AI tools structured metadata and semantic definitions so natural language queries resolve to the exact same governed SQL every single time.
Discussion Question
How does your team currently handle metric definitions? Are you using a centralized semantic layer, or do different departments still maintain their own independent dashboard formulas?
CTA (Join Data Science & Analytics)
Want to master advanced data modeling, semantic architecture, and modern analytics engineering patterns? Join Data Science & Analytics to connect with global data professionals building reliable, scalable systems.
The Metric Drift Illusion: Why Your Dashboards Agree on Nothing and Your AI is Lying
With modern data architectures shifting toward decentralized domains, semantic layers, and automated AI consumption, data teams face a structural crisis. When every department calculates core metrics independently across disconnected dbt models, looker views, or ad-hoc SQL scripts, you don't have a data-driven culture—you have an organized guessing game.
Why It Matters
Traditional reporting treated metrics as UI-level logic inside individual dashboards. When business users or LLM agents query a data warehouse directly, they don't see those dashboard filters or hidden business rules. If your business definitions live inside fragmented tools rather than a centralized governed layer, AI agents will hallucinate metrics, executives will argue over spreadsheet discrepancies in board meetings, and trust in analytics will evaporate.
What You Need to Know: Engineering a Single Source of Truth
To eliminate metric drift and make your data stack AI-ready, data professionals must implement rigorous semantic governance:
Centralize Metric Definitions as Code: Move away from dashboard-locked formulas. Define business-critical metrics (like ARR, churn, or net retention) once in code using version-controlled semantic layers or transformation tools.
Enforce Grain and Join Boundaries: Clearly document and lock down table grains and foreign-key join paths. Prevent users and AI tools from carelessly performing many-to-many joins that result in silent double-counting and fanouts.
Expose Governed Context to AI Layers: Never plug an LLM directly into raw, unmapped database schemas. Feed AI tools structured metadata and semantic definitions so natural language queries resolve to the exact same governed SQL every single time.
Discussion Question
How does your team currently handle metric definitions? Are you using a centralized semantic layer, or do different departments still maintain their own independent dashboard formulas?
CTA (Join Data Science & Analytics)
Want to master advanced data modeling, semantic architecture, and modern analytics engineering patterns? Join Data Science & Analytics to connect with global data professionals building reliable, scalable systems.

 English
 Arabic
 French
 Spanish
 Portuguese
 Turkish
 Dutch
Dutch
 Italiano
 Russian
 Romaian
 Portuguese (Brazil)
 Greek
Greek