


The Death of the Static Dashboard: Why Modern Data Teams Are Pivoting to Semantic Layers and Metric Stores
For years, the standard analytics playbook looked identical: pull raw data from the warehouse, write custom SQL transformations in 15 different BI tools, and render static charts for leadership.
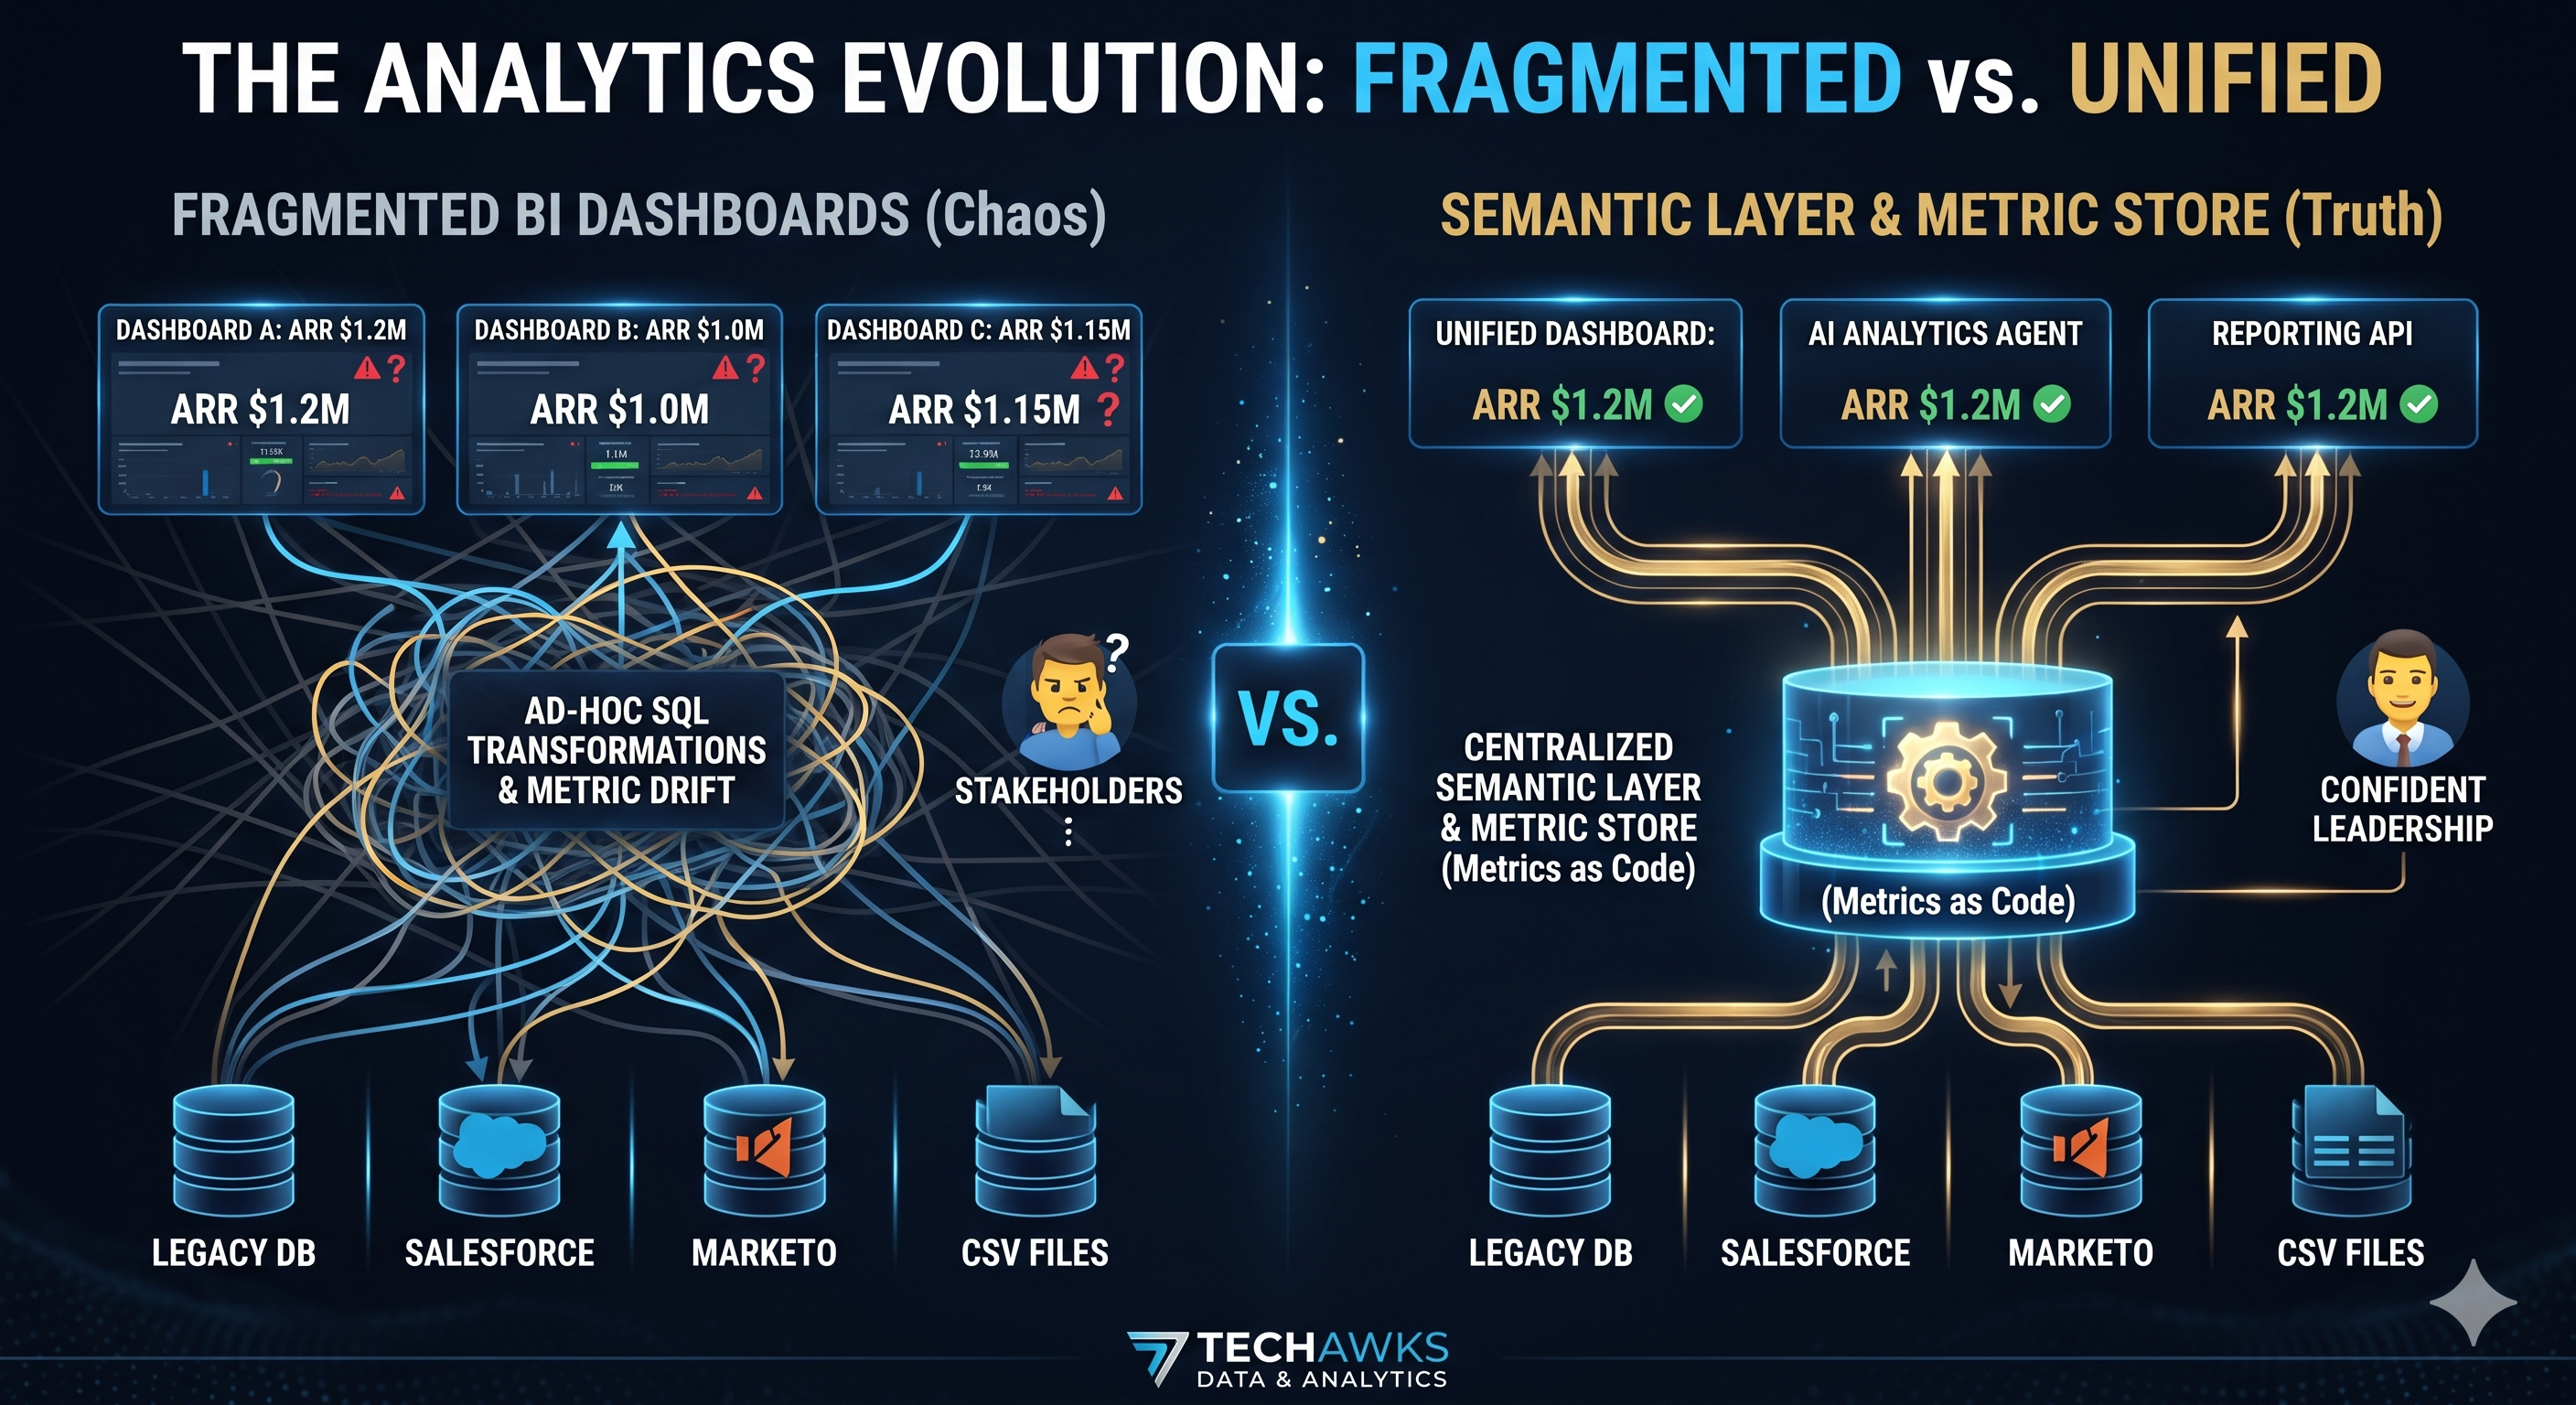
The result? Metric drift. When Marketing calculates "Active User" one way in Tableau and Finance calculates it differently in Looker, trust in data collapses.
That is why modern data engineering and analytics teams are rapidly migrating away from isolated dashboard development toward centralized Semantic Layers and Headless Metric Stores. Instead of defining business logic inside individual reports, you define metrics once as code (using tools like dbt semantics or Cube), decoupling your definitions from your visualization layer.
What you need to implement in your stack:
Centralized Metric Governance: Write your business logic (like churn rate, ARR, or active session) as version-controlled code so every downstream dashboard and LLM agent pulls the exact same truth.
Semantic API Integration: Expose your metrics via standardized APIs so automated pipelines, executive reports, and AI query agents query governed definitions instead of raw tables.
Shift from Reporters to Architects: Stop spending 80% of your time rebuilding ad-hoc charts. Pivot your role toward architecting reliable data models and semantic frameworks.
Discussion Question
Are you still dealing with conflicting metric definitions across different BI tools in your organization, or have you implemented a centralized semantic layer or metric store?
CTA (Join Data Science & Analytics)
Ready to master modern data architecture, eliminate metric drift, and build scalable analytics pipelines with top-tier professionals? Join Data Science & Analytics today and elevate your data career.
The Death of the Static Dashboard: Why Modern Data Teams Are Pivoting to Semantic Layers and Metric Stores
For years, the standard analytics playbook looked identical: pull raw data from the warehouse, write custom SQL transformations in 15 different BI tools, and render static charts for leadership.
The result? Metric drift. When Marketing calculates "Active User" one way in Tableau and Finance calculates it differently in Looker, trust in data collapses.
That is why modern data engineering and analytics teams are rapidly migrating away from isolated dashboard development toward centralized Semantic Layers and Headless Metric Stores. Instead of defining business logic inside individual reports, you define metrics once as code (using tools like dbt semantics or Cube), decoupling your definitions from your visualization layer.
What you need to implement in your stack:
Centralized Metric Governance: Write your business logic (like churn rate, ARR, or active session) as version-controlled code so every downstream dashboard and LLM agent pulls the exact same truth.
Semantic API Integration: Expose your metrics via standardized APIs so automated pipelines, executive reports, and AI query agents query governed definitions instead of raw tables.
Shift from Reporters to Architects: Stop spending 80% of your time rebuilding ad-hoc charts. Pivot your role toward architecting reliable data models and semantic frameworks.
Discussion Question
Are you still dealing with conflicting metric definitions across different BI tools in your organization, or have you implemented a centralized semantic layer or metric store?
CTA (Join Data Science & Analytics)
Ready to master modern data architecture, eliminate metric drift, and build scalable analytics pipelines with top-tier professionals? Join Data Science & Analytics today and elevate your data career.

 English
 Arabic
 Spanish
 Portuguese
 Deutsch
 Turkish
 Dutch
 Italiano
 Russian
 Romaian
 Portuguese (Brazil)
 Greek