


The 4-Step Framework for Debugging Data Discrepancies in Production
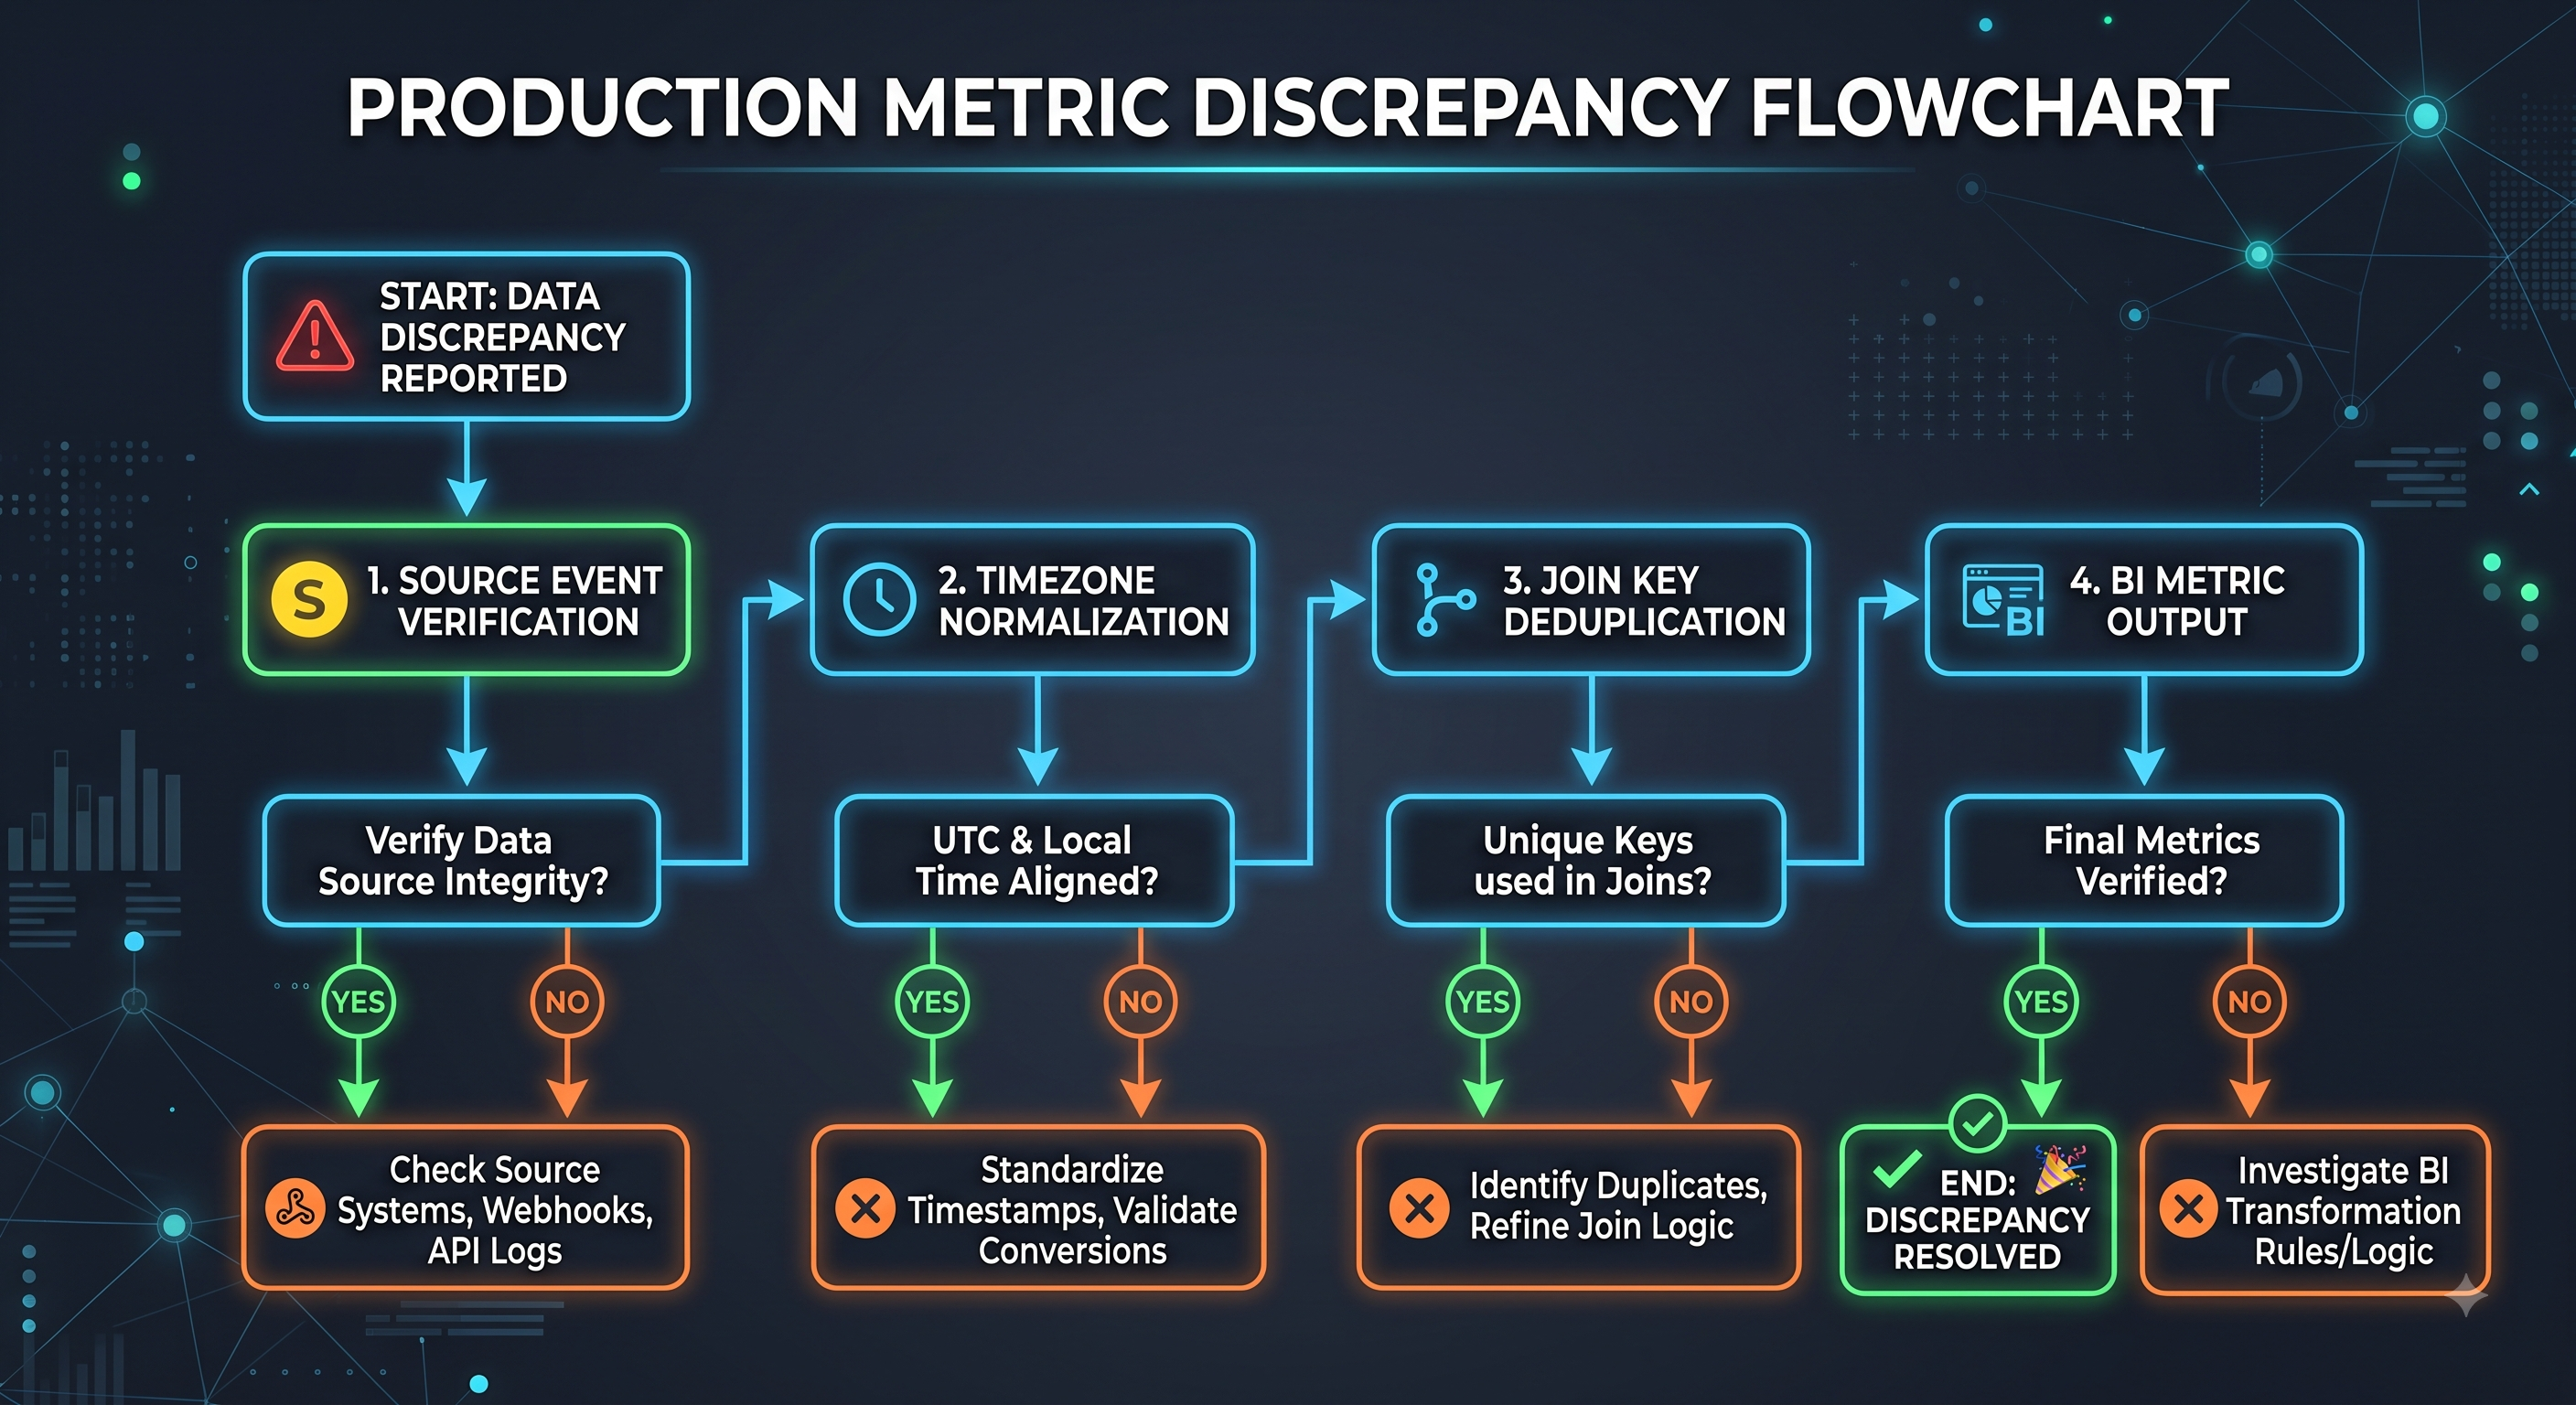
Data discrepancies rarely stem from complex edge cases; they usually hide in transformations, joins, or time boundaries. When metrics drift between production and reporting layers, follow this isolation sequence:
1. Verify Time Boundary & Granularity Alignment
Check for mismatched timezone conversions (e.g., UTC in production versus EST in BI layers).
Confirm whether date truncations are applied consistently (e.g., DATE_TRUNC('day', timestamp) before versus after filtering).
2. Inspect Join Multiplicity
Run quick cardinality checks on joined keys:
SQL
SELECT key_id, COUNT(*)
FROM staging_table
GROUP BY key_id
HAVING COUNT(*) > 1;
Unintended 1:Many relationships create silent row duplication that inflates additive metrics like revenue or volume.
3. Trace Filter & NULL Handling Drift
Identify subtle differences in WHERE clauses (e.g., status = 'completed' excluding NULL records that were previously valid).
Test for three-valued logic pitfalls where WHERE column != 'failed' accidentally drops rows where column IS NULL.
4. Compare Grain at the Source vs. Aggregate Layer
Isolate the divergence point by creating side-by-side reconciliation slices across discrete dimensions (e.g., by region or date).
Calculate delta variances per segment: (BI_Value - Source_Value) / Source_Value. The dimension with the highest variance isolates the faulty transformation step.
Key Takeaways
Always check timezone definitions and aggregation boundaries first.
Silent row duplication from non-unique joins is the leading cause of metric inflation.
Account for SQL three-valued logic when filtering non-null values.
Slice metrics by dimensional segments to pinpoint the exact failure point.
CTA
Want to master production-grade data modeling, pipeline optimization, and advanced analytics workflows?
Join Techawks Data Science & Analytics to connect with fellow data professionals, access curated technical frameworks, and level up your data career.
Data discrepancies rarely stem from complex edge cases; they usually hide in transformations, joins, or time boundaries. When metrics drift between production and reporting layers, follow this isolation sequence:
1. Verify Time Boundary & Granularity Alignment
Check for mismatched timezone conversions (e.g., UTC in production versus EST in BI layers).
Confirm whether date truncations are applied consistently (e.g., DATE_TRUNC('day', timestamp) before versus after filtering).
2. Inspect Join Multiplicity
Run quick cardinality checks on joined keys:
SQL
SELECT key_id, COUNT(*)
FROM staging_table
GROUP BY key_id
HAVING COUNT(*) > 1;
Unintended 1:Many relationships create silent row duplication that inflates additive metrics like revenue or volume.
3. Trace Filter & NULL Handling Drift
Identify subtle differences in WHERE clauses (e.g., status = 'completed' excluding NULL records that were previously valid).
Test for three-valued logic pitfalls where WHERE column != 'failed' accidentally drops rows where column IS NULL.
4. Compare Grain at the Source vs. Aggregate Layer
Isolate the divergence point by creating side-by-side reconciliation slices across discrete dimensions (e.g., by region or date).
Calculate delta variances per segment: (BI_Value - Source_Value) / Source_Value. The dimension with the highest variance isolates the faulty transformation step.
Key Takeaways
Always check timezone definitions and aggregation boundaries first.
Silent row duplication from non-unique joins is the leading cause of metric inflation.
Account for SQL three-valued logic when filtering non-null values.
Slice metrics by dimensional segments to pinpoint the exact failure point.
CTA
Want to master production-grade data modeling, pipeline optimization, and advanced analytics workflows?
Join Techawks Data Science & Analytics to connect with fellow data professionals, access curated technical frameworks, and level up your data career.
The 4-Step Framework for Debugging Data Discrepancies in Production
Data discrepancies rarely stem from complex edge cases; they usually hide in transformations, joins, or time boundaries. When metrics drift between production and reporting layers, follow this isolation sequence:
1. Verify Time Boundary & Granularity Alignment
Check for mismatched timezone conversions (e.g., UTC in production versus EST in BI layers).
Confirm whether date truncations are applied consistently (e.g., DATE_TRUNC('day', timestamp) before versus after filtering).
2. Inspect Join Multiplicity
Run quick cardinality checks on joined keys:
SQL
SELECT key_id, COUNT(*)
FROM staging_table
GROUP BY key_id
HAVING COUNT(*) > 1;
Unintended 1:Many relationships create silent row duplication that inflates additive metrics like revenue or volume.
3. Trace Filter & NULL Handling Drift
Identify subtle differences in WHERE clauses (e.g., status = 'completed' excluding NULL records that were previously valid).
Test for three-valued logic pitfalls where WHERE column != 'failed' accidentally drops rows where column IS NULL.
4. Compare Grain at the Source vs. Aggregate Layer
Isolate the divergence point by creating side-by-side reconciliation slices across discrete dimensions (e.g., by region or date).
Calculate delta variances per segment: (BI_Value - Source_Value) / Source_Value. The dimension with the highest variance isolates the faulty transformation step.
Key Takeaways
Always check timezone definitions and aggregation boundaries first.
Silent row duplication from non-unique joins is the leading cause of metric inflation.
Account for SQL three-valued logic when filtering non-null values.
Slice metrics by dimensional segments to pinpoint the exact failure point.
CTA
Want to master production-grade data modeling, pipeline optimization, and advanced analytics workflows?
Join Techawks Data Science & Analytics to connect with fellow data professionals, access curated technical frameworks, and level up your data career.

 Arabic
 French
 Spanish
 Portuguese
 Deutsch
 Turkish
 Dutch
Dutch
 Italiano
 Russian
 Romaian
 Portuguese (Brazil)
 Greek
Greek