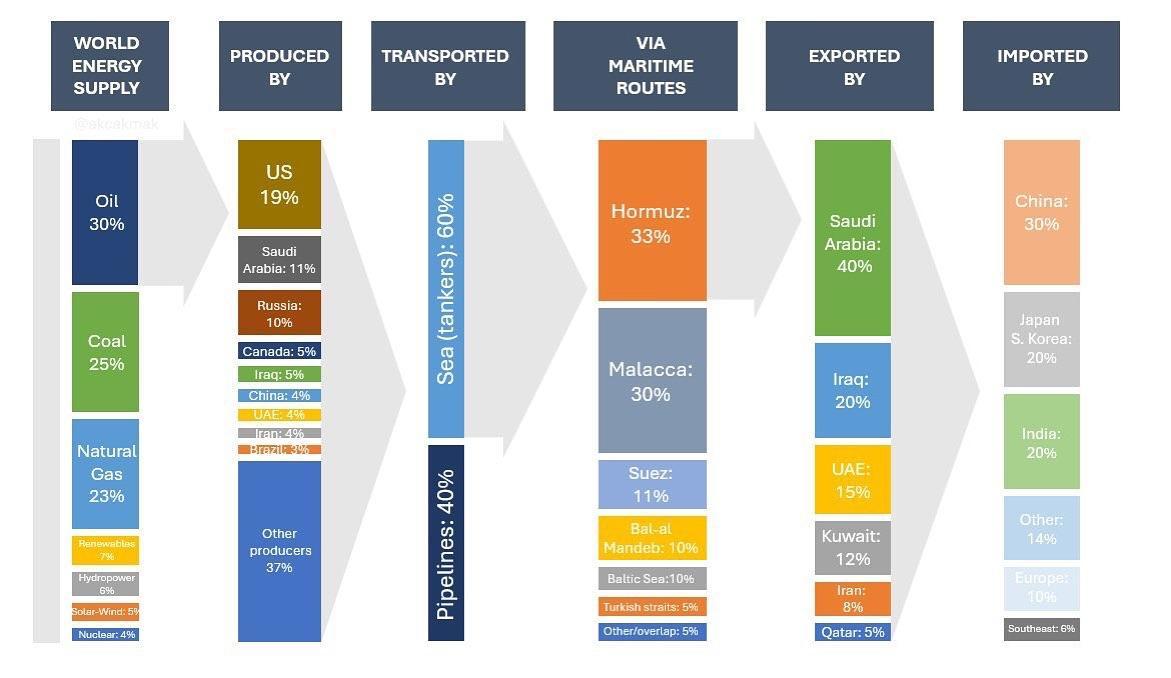
Oil accounts for 30% of the world’s energy supply. The top producers are the US with 19%, followed by Saudi Arabia at 11%, and Russia at 10%. Other key players like Canada, Iraq, China, the UAE, Iran, and Brazil each contribute between 4–5%, with the rest of the world making up 37%.
Once extracted, oil is primarily transported by sea—around 60% of global flows move via tankers, while 40% are piped across borders. These maritime routes are critical chokepoints in the global system. The Strait of Hormuz handles a third of all seaborne oil, while the Strait of Malacca sees about 30%. Other key routes include the Suez Canal (11%), Bab al-Mandeb (10%), and the Turkish Straits and Baltic Sea (5% each).
Saudi Arabia leads global exports with 40%, followed by Iraq (20%), the UAE (15%), and Kuwait (12%). Iran, Qatar, and others round out the rest. On the import side, China dominates with 30% of global intake, followed by Japan and South Korea at 20%, India at 20%, Europe at 10%, and other nations making up the remainder.
This chart reveals just how interconnected—and vulnerable—the global oil market is to geopolitical shocks and supply chain disruptions.
#OilMarket #EnergySecurity #Geopolitics #OilProduction #OilTransport #EnergyTrade #CrudeOil #StraitOfHormuz #GlobalEconomy #Commodities #OilSupplyChain #EnergyGeopolitics
Oil accounts for 30% of the world’s energy supply. The top producers are the US with 19%, followed by Saudi Arabia at 11%, and Russia at 10%. Other key players like Canada, Iraq, China, the UAE, Iran, and Brazil each contribute between 4–5%, with the rest of the world making up 37%.
Once extracted, oil is primarily transported by sea—around 60% of global flows move via tankers, while 40% are piped across borders. These maritime routes are critical chokepoints in the global system. The Strait of Hormuz handles a third of all seaborne oil, while the Strait of Malacca sees about 30%. Other key routes include the Suez Canal (11%), Bab al-Mandeb (10%), and the Turkish Straits and Baltic Sea (5% each).
Saudi Arabia leads global exports with 40%, followed by Iraq (20%), the UAE (15%), and Kuwait (12%). Iran, Qatar, and others round out the rest. On the import side, China dominates with 30% of global intake, followed by Japan and South Korea at 20%, India at 20%, Europe at 10%, and other nations making up the remainder.
This chart reveals just how interconnected—and vulnerable—the global oil market is to geopolitical shocks and supply chain disruptions.
#OilMarket #EnergySecurity #Geopolitics #OilProduction #OilTransport #EnergyTrade #CrudeOil #StraitOfHormuz #GlobalEconomy #Commodities #OilSupplyChain #EnergyGeopolitics
·2KB Ansichten
·0 Bewertungen