


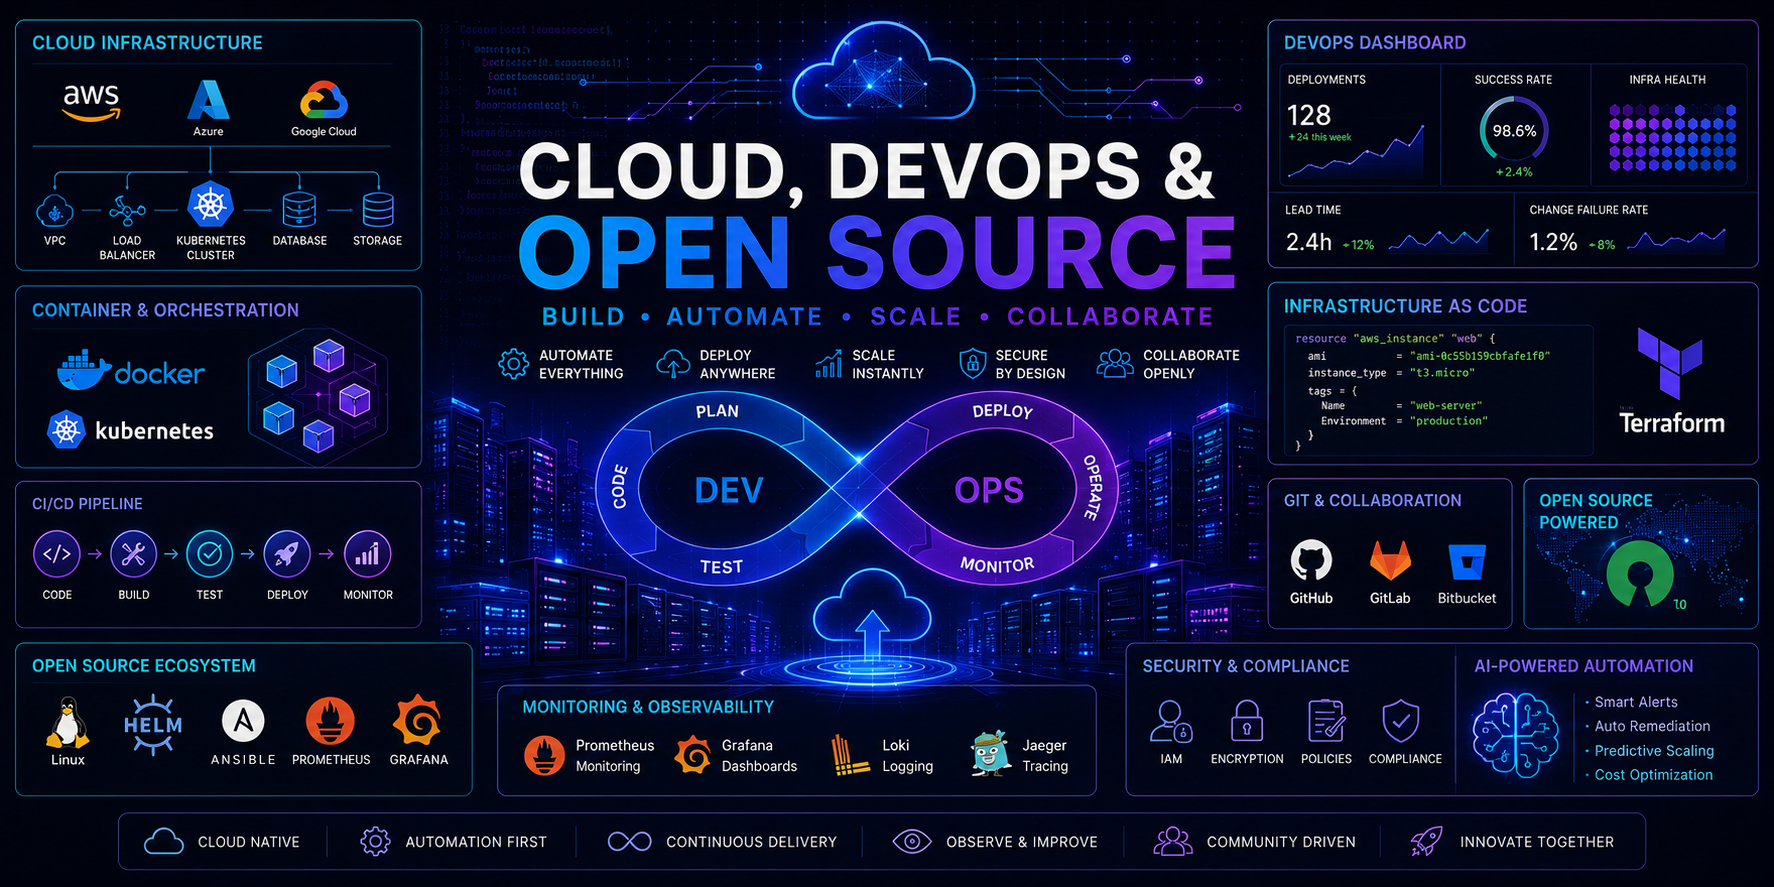
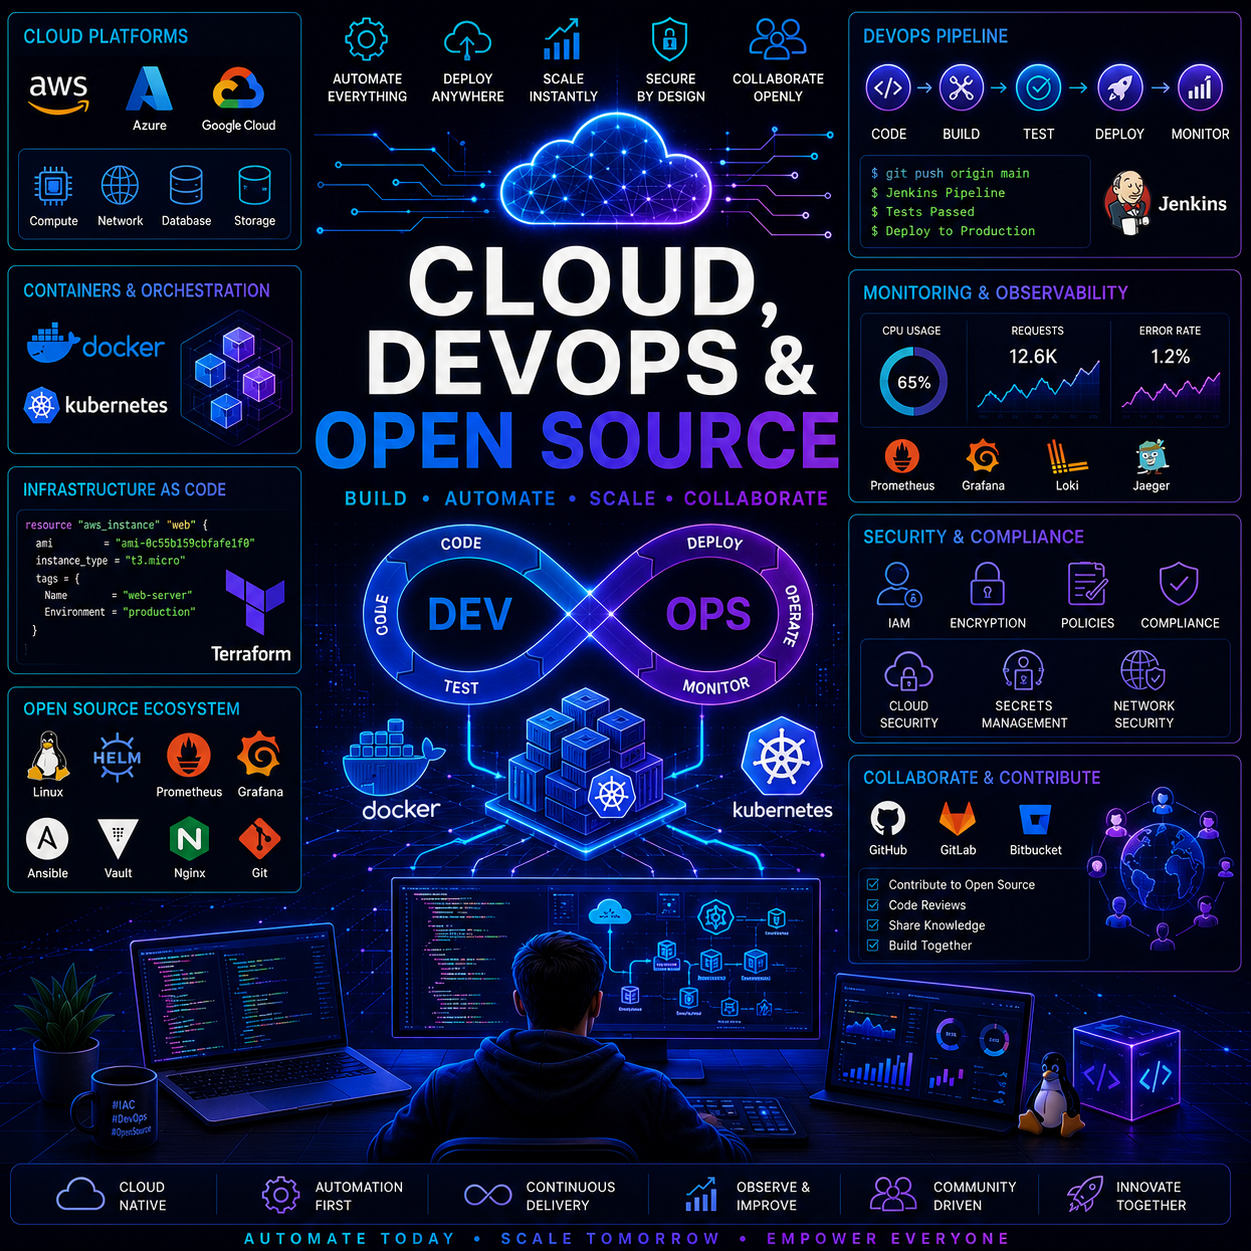
Cloud, DevOps & Open Source is a Techawks community for developers, cloud engineers, DevOps professionals, SREs, system administrators, and open-source contributors who want to build, automate, and scale modern software infrastructure. Explore cloud platforms, infrastructure as code, CI/CD, containers, Kubernetes, and distributed systems.
Learn through practical tutorials, architecture discussions, automation workflows, real-world deployment strategies, open-source projects, certifications, career guidance, and community collaboration. Connect with professionals who are passionate about building reliable, scalable, and secure cloud-native solutions.
Learn through practical tutorials, architecture discussions, automation workflows, real-world deployment strategies, open-source projects, certifications, career guidance, and community collaboration. Connect with professionals who are passionate about building reliable, scalable, and secure cloud-native solutions.
-
Public Group
-
61 Posts
-
61 Photos
-
0 Videos
-
Reviews
-
Science and Technology
Search

 Arabic
 French
 Spanish
 Portuguese
 Deutsch
 Turkish
 Dutch
Dutch
 Italiano
 Russian
 Romaian
 Portuguese (Brazil)
 Greek
Greek
Recent Updates
-
Automating Progressive Delivery: Implementing Canary Deployments with Flagger, Argo Rollouts, and Metric Analysis
True resilience in continuous delivery isn't just about automated deployment pipelines; it is about automated rollback safety. Progressive delivery replaces binary cutovers with data-driven traffic shaping, incrementally exposing real user traffic to new revisions while actively evaluating Prometheus latency and error-rate percentiles.
Here is a practical, step-by-step tutorial on building an automated Canary deployment pipeline using Kubernetes, Argo Rollouts (or Flagger), and metric-driven analysis.1. Define the Rollout Spec Over Standard Deployments A standard Kubernetes Deployment object offers basic rolling updates, but lacks native ingress traffic splitting and automated metric gating.
Replace your workload kind with an Argo Rollout or define a Flagger Canary custom resource definition (CRD).Decouple the deployment into two distinct Service definitions:
Stable Service: Routes live traffic to the verified revision.
Canary Service: Routes traffic exclusively to the candidate pods during the evaluation window.
Connect these services to your Ingress controller or service mesh (Envoy, Istio, Traefik, or NGINX) to enable fine-grained weight adjustments.2. Configure Incremental Traffic StepsAvoid jumping straight to 50% traffic. Design progressive step intervals with mandatory soak periods:YAMLspec:
strategy:
canary:
canaryService: payment-svc-canary
stableService: payment-svc-stable
trafficRouting:
nginx:
stableIngress: payment-ingress
steps:
- setWeight: 5
- pause: { duration: 5m }
- setWeight: 20
- pause: { duration: 10m }
- setWeight: 50
- pause: { duration: 10m }
Step 1 (5% Weight): Validates baseline boot health, certificate bindings, and edge-case routing without exposing the majority of users.
Pause Intervals: Ensure adequate time for your telemetry stack to accumulate statistically significant metric samples before escalating.3. Establish Production Metric Templates (AnalysisRuns)Never rely on human observation or simple HTTP 200 checks to validate a release. Attach automated metric queries directly to each step:
HTTP Error Rate Threshold (p99):Query Prometheus to assert that the canary error rate remains under 0.5%:Code snippetsum(rate(http_requests_total{status=~"5.*", app="payment-svc-canary"}[2m]))
/
sum(rate(http_requests_total{app="payment-svc-canary"}[2m])) * 100 < 0.5
Latency Budget (p95):Assert that upstream response time does not regress compared to the stable baseline:
Code snippethistogram_quantile(0.95, sum(rate(http_request_duration_seconds_bucket{app="payment-svc-canary"}[2m])) by (le)) < 0.250
Configure consecutive failure limits (e.g., failureLimit: 2). If two back-to-back analysis checks breach the threshold, the controller halts progression immediately.4. Deterministic Automated Rollbacks
The defining power of progressive delivery is the automated abort sequence:
The moment an AnalysisRun registers consecutive metric failures, the controller resets the Ingress weight to 0% on the canary service within milliseconds.
All incoming production traffic instantly flows 100% through the untouched, proven stable pods.
The failed candidate pods are kept alive in an isolated state for 15 minutes to allow engineering teams to scrape heap dumps, inspect logs, and capture profiling data before pod eviction.
Key Takeaways
Shrink the Blast Radius: Step-based traffic ramping (5% $\rightarrow$ 20% $\rightarrow$ 50%) guarantees that infrastructure failures impact only a tiny fraction of users.
Telemetry as the Gatekeeper: Use Prometheus metrics (p95 latency and 5xx error percentages) rather than manual gut-checks to promote builds.
Decouple Stable and Canary: Maintain separate stable and candidate services behind an ingress router capable of weight-based traffic shifting.
Instant Reversion with Post-Mortem Capture: Abort failed weights in milliseconds, but hold candidate pods temporarily to extract runtime debug artifacts.
CTA
How does your team handle continuous deployment safety in production today?Are you running automated canary rollouts via Argo/Flagger, executing manual blue/green cutovers, or relying purely on feature flags like LaunchDarkly or Unleash? Share your deployment strategies, pipeline pain points, and edge-case rollback experiences below.Automating Progressive Delivery: Implementing Canary Deployments with Flagger, Argo Rollouts, and Metric Analysis True resilience in continuous delivery isn't just about automated deployment pipelines; it is about automated rollback safety. Progressive delivery replaces binary cutovers with data-driven traffic shaping, incrementally exposing real user traffic to new revisions while actively evaluating Prometheus latency and error-rate percentiles. Here is a practical, step-by-step tutorial on building an automated Canary deployment pipeline using Kubernetes, Argo Rollouts (or Flagger), and metric-driven analysis.1. Define the Rollout Spec Over Standard Deployments A standard Kubernetes Deployment object offers basic rolling updates, but lacks native ingress traffic splitting and automated metric gating. Replace your workload kind with an Argo Rollout or define a Flagger Canary custom resource definition (CRD).Decouple the deployment into two distinct Service definitions: Stable Service: Routes live traffic to the verified revision. Canary Service: Routes traffic exclusively to the candidate pods during the evaluation window. Connect these services to your Ingress controller or service mesh (Envoy, Istio, Traefik, or NGINX) to enable fine-grained weight adjustments.2. Configure Incremental Traffic StepsAvoid jumping straight to 50% traffic. Design progressive step intervals with mandatory soak periods:YAMLspec: strategy: canary: canaryService: payment-svc-canary stableService: payment-svc-stable trafficRouting: nginx: stableIngress: payment-ingress steps: - setWeight: 5 - pause: { duration: 5m } - setWeight: 20 - pause: { duration: 10m } - setWeight: 50 - pause: { duration: 10m } Step 1 (5% Weight): Validates baseline boot health, certificate bindings, and edge-case routing without exposing the majority of users. Pause Intervals: Ensure adequate time for your telemetry stack to accumulate statistically significant metric samples before escalating.3. Establish Production Metric Templates (AnalysisRuns)Never rely on human observation or simple HTTP 200 checks to validate a release. Attach automated metric queries directly to each step: HTTP Error Rate Threshold (p99):Query Prometheus to assert that the canary error rate remains under 0.5%:Code snippetsum(rate(http_requests_total{status=~"5.*", app="payment-svc-canary"}[2m])) / sum(rate(http_requests_total{app="payment-svc-canary"}[2m])) * 100 < 0.5 Latency Budget (p95):Assert that upstream response time does not regress compared to the stable baseline: Code snippethistogram_quantile(0.95, sum(rate(http_request_duration_seconds_bucket{app="payment-svc-canary"}[2m])) by (le)) < 0.250 Configure consecutive failure limits (e.g., failureLimit: 2). If two back-to-back analysis checks breach the threshold, the controller halts progression immediately.4. Deterministic Automated Rollbacks The defining power of progressive delivery is the automated abort sequence: The moment an AnalysisRun registers consecutive metric failures, the controller resets the Ingress weight to 0% on the canary service within milliseconds. All incoming production traffic instantly flows 100% through the untouched, proven stable pods. The failed candidate pods are kept alive in an isolated state for 15 minutes to allow engineering teams to scrape heap dumps, inspect logs, and capture profiling data before pod eviction. Key Takeaways Shrink the Blast Radius: Step-based traffic ramping (5% $\rightarrow$ 20% $\rightarrow$ 50%) guarantees that infrastructure failures impact only a tiny fraction of users. Telemetry as the Gatekeeper: Use Prometheus metrics (p95 latency and 5xx error percentages) rather than manual gut-checks to promote builds. Decouple Stable and Canary: Maintain separate stable and candidate services behind an ingress router capable of weight-based traffic shifting. Instant Reversion with Post-Mortem Capture: Abort failed weights in milliseconds, but hold candidate pods temporarily to extract runtime debug artifacts. CTA How does your team handle continuous deployment safety in production today?Are you running automated canary rollouts via Argo/Flagger, executing manual blue/green cutovers, or relying purely on feature flags like LaunchDarkly or Unleash? Share your deployment strategies, pipeline pain points, and edge-case rollback experiences below.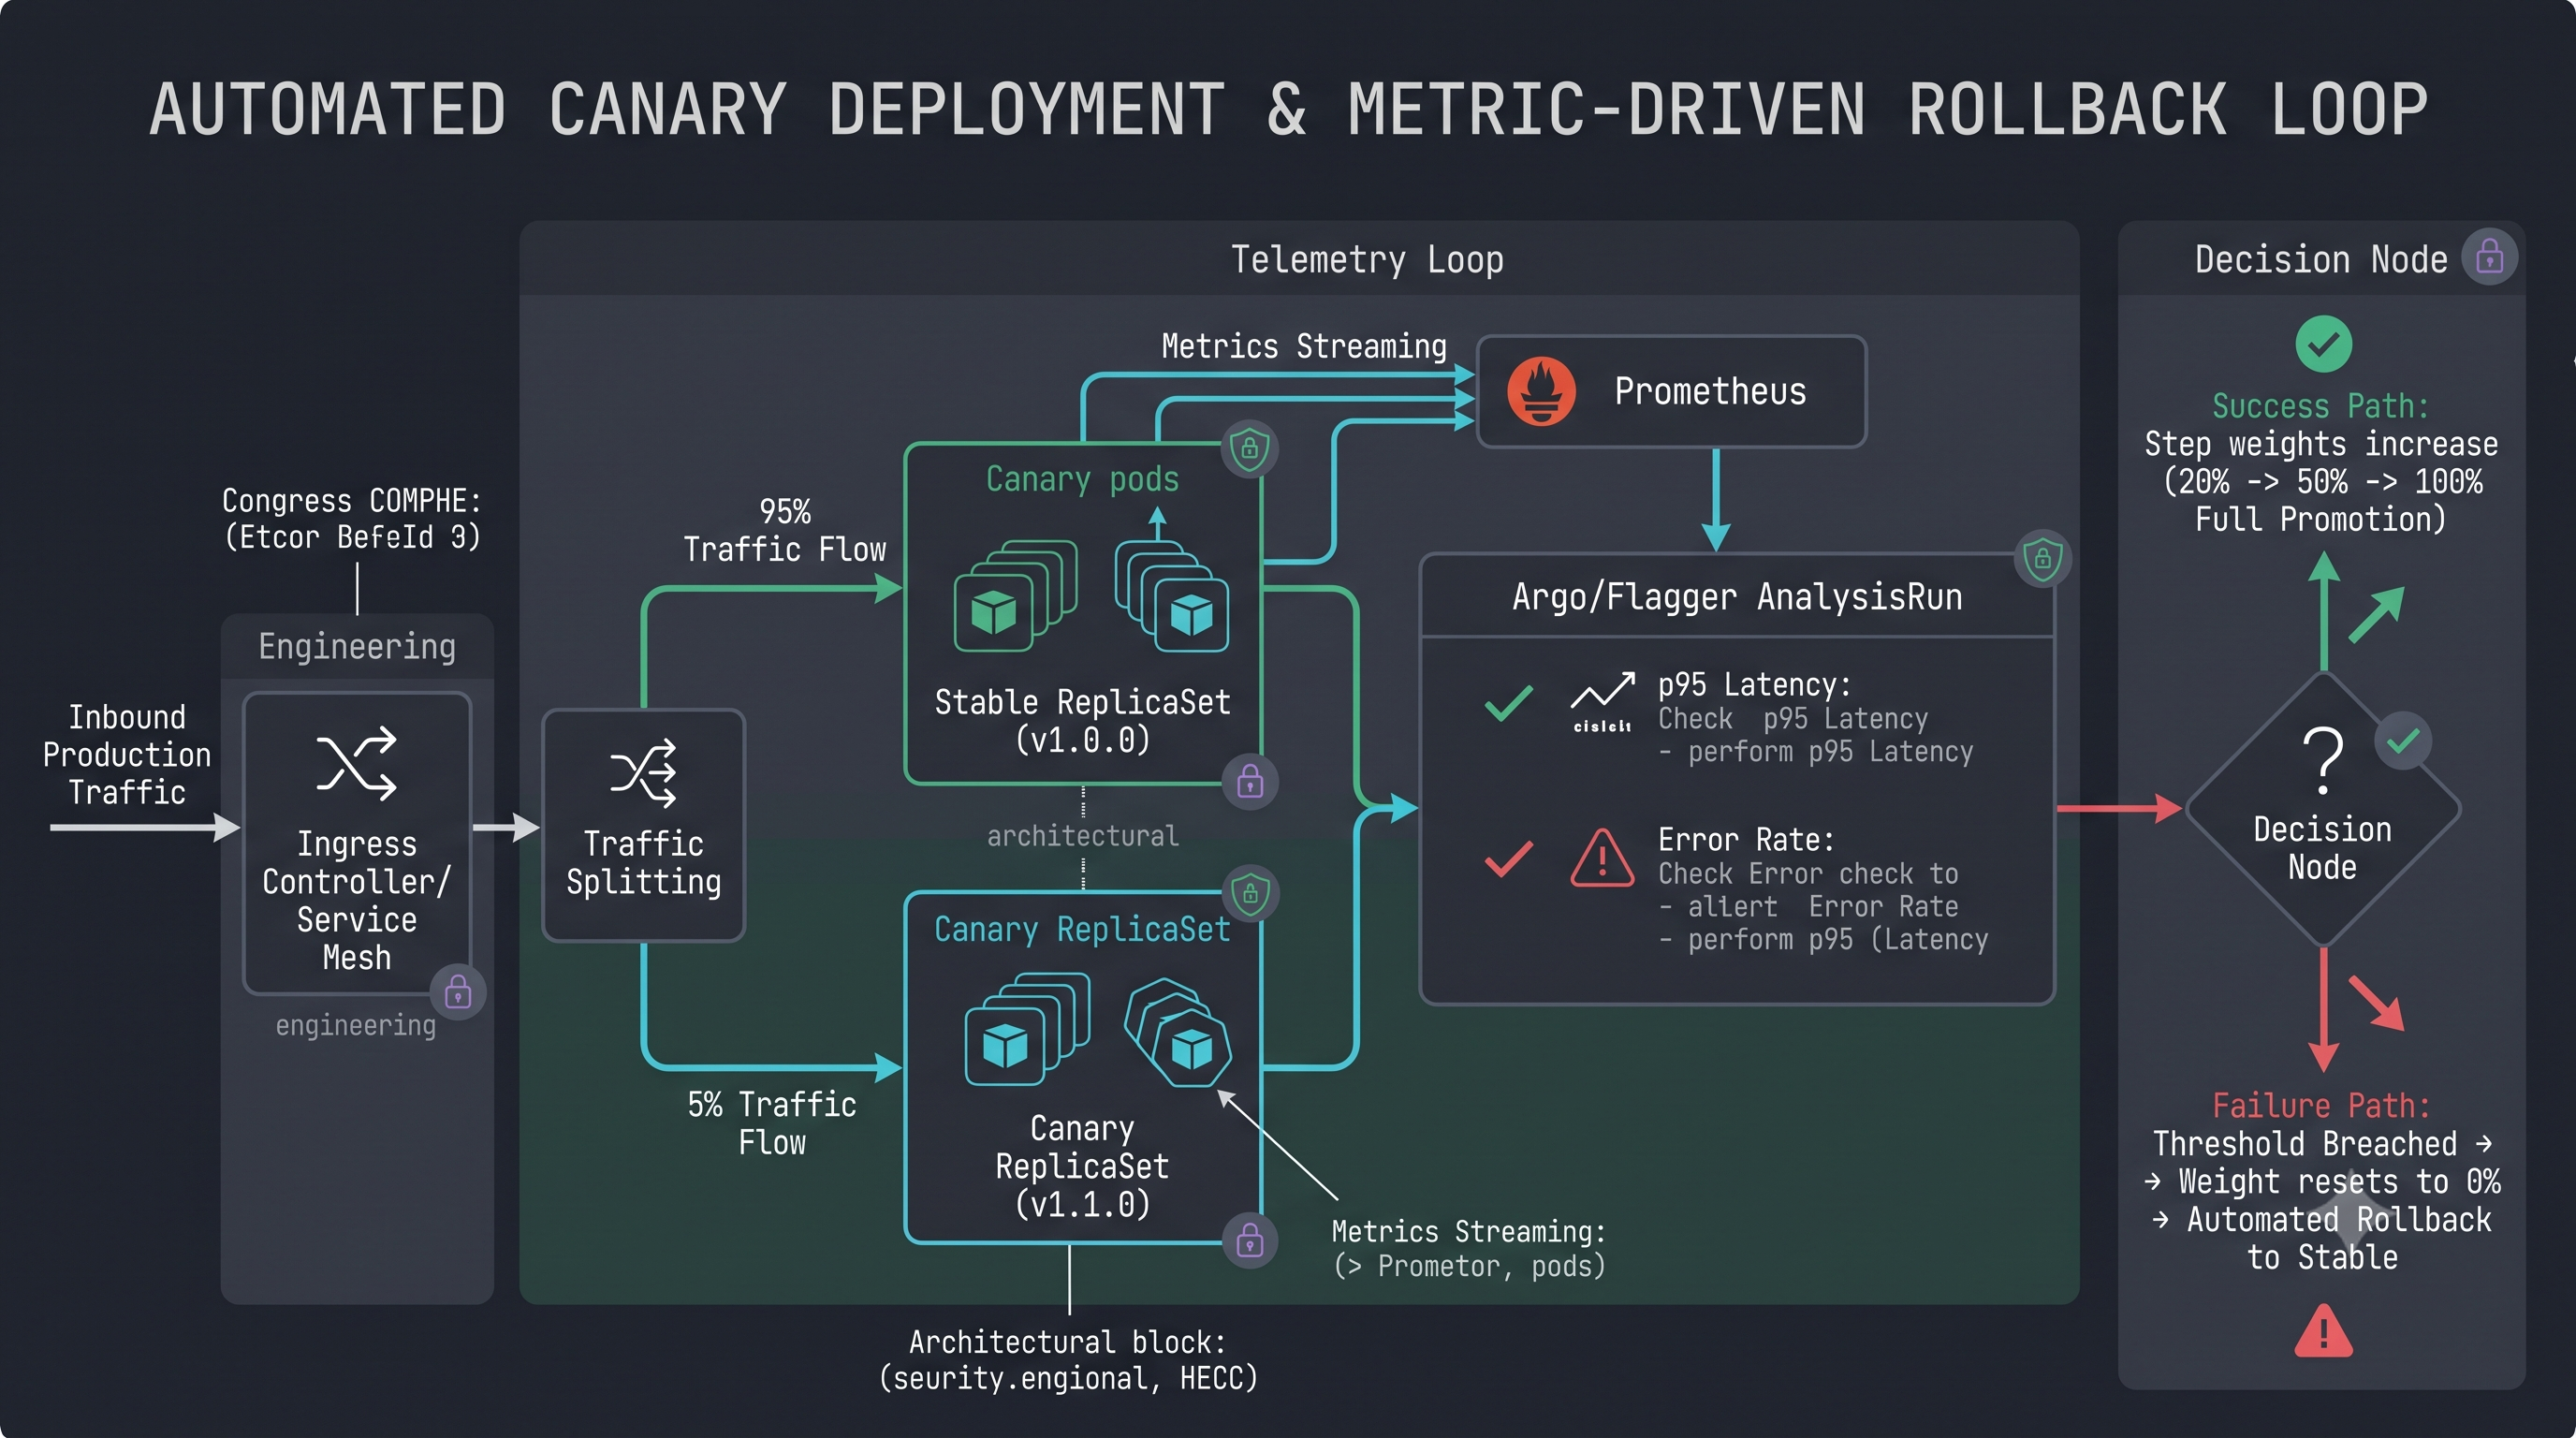 0 Comments 0 Shares 6 Views 0 Reviews
 -
The Cascade Outage Trap: Why "Headroom Exhaustion" Kills Kubernetes Clusters (And the Day-2 Deployment Checklist)
Postmortems across major cloud-native providers (including GitHub’s August 2026 infrastructure incident) highlight an uncomfortable operational reality: routine rolling deployments routinely trigger catastrophic cascading failures when service mesh and platform sidecars run near capacity limits.
Here is what happens under the hood during a standard deployment:
When pods rotate, cluster compute headroom dips momentarily.
Proxy sidecars (Envoy, Linkerd, istio-proxy) and agent containers experience CPU throttling and memory pressure.
Pods enter OOMKilled crash loops, causing connection retries to compound across the shared ingress gateway and authentication services.
Load-balancer flow limits exhaust, turning a standard minor deployment into an unrecoverable multi-cluster blackout.
With over 82% of enterprise workloads now running Kubernetes in production, your deployments cannot treat pod capacity and sidecar overhead as an afterthought.
Before triggering your next large-scale production rollout or GitOps sync, run your cluster through this Day-2 resiliency checklist:
☸️ The 5-Point Rolling Deployment & Capacity Headroom Checklist
[ ] 1. Ingress & Service Mesh Surge Headroom: Do your ingress gateway nodes and sidecar proxies have at least 30% dedicated compute and memory buffers above peak usage? A rolling deployment temporarily spikes proxy connection handshakes—never run them near 90% allocation.
[ ] 2. PodDisruptionBudget (PDB) & MaxSurge Alignment: Validate that maxSurge and maxUnavailable in your deployment specs do not drop total active pod capacity below baseline traffic demand, especially during simultaneous auto-scaling events.
[ ] 3. Strict Sidecar Resource Isolation: Ensure infrastructure sidecars (logging agents, tracing, security daemons) have independent requests and limits explicitly defined. A runaway main container should never starve your telemetry or proxy sidecar of memory.
[ ] 4. Circuit Breaking & Exponential Backoff on Retries: When upstream pods restart, downstream clients must implement jittered exponential backoff. Without strict circuit breaking at the gateway layer, immediate retry storms will exhaust load-balancer socket connections.
[ ] 5. Automated Canary Gating (Halt on DNS/Mesh Latency): Configure your progressive delivery controllers (Argo Rollouts, Flagger) to halt canary progression not just on HTTP 5xx codes, but on proxy latency spikes, upstream connection drops, or CoreDNS query latency.
Discussion Question
When you roll out major cluster updates or large-scale deployments, how does your team protect against sidecar/proxy throttling and retry storms? Do you rely on automated canary rollouts, strict PDBs, or dedicated node pools for critical platform gateways?
CTA (Share Deployment Experiences)
Drop your war stories below! What was the sneakisiest deployment failure or cascading cluster outage you've had to debug in production, and what guardrail did you install to make sure it never happens again?The Cascade Outage Trap: Why "Headroom Exhaustion" Kills Kubernetes Clusters (And the Day-2 Deployment Checklist) Postmortems across major cloud-native providers (including GitHub’s August 2026 infrastructure incident) highlight an uncomfortable operational reality: routine rolling deployments routinely trigger catastrophic cascading failures when service mesh and platform sidecars run near capacity limits. Here is what happens under the hood during a standard deployment: When pods rotate, cluster compute headroom dips momentarily. Proxy sidecars (Envoy, Linkerd, istio-proxy) and agent containers experience CPU throttling and memory pressure. Pods enter OOMKilled crash loops, causing connection retries to compound across the shared ingress gateway and authentication services. Load-balancer flow limits exhaust, turning a standard minor deployment into an unrecoverable multi-cluster blackout. With over 82% of enterprise workloads now running Kubernetes in production, your deployments cannot treat pod capacity and sidecar overhead as an afterthought. Before triggering your next large-scale production rollout or GitOps sync, run your cluster through this Day-2 resiliency checklist: ☸️ The 5-Point Rolling Deployment & Capacity Headroom Checklist [ ] 1. Ingress & Service Mesh Surge Headroom: Do your ingress gateway nodes and sidecar proxies have at least 30% dedicated compute and memory buffers above peak usage? A rolling deployment temporarily spikes proxy connection handshakes—never run them near 90% allocation. [ ] 2. PodDisruptionBudget (PDB) & MaxSurge Alignment: Validate that maxSurge and maxUnavailable in your deployment specs do not drop total active pod capacity below baseline traffic demand, especially during simultaneous auto-scaling events. [ ] 3. Strict Sidecar Resource Isolation: Ensure infrastructure sidecars (logging agents, tracing, security daemons) have independent requests and limits explicitly defined. A runaway main container should never starve your telemetry or proxy sidecar of memory. [ ] 4. Circuit Breaking & Exponential Backoff on Retries: When upstream pods restart, downstream clients must implement jittered exponential backoff. Without strict circuit breaking at the gateway layer, immediate retry storms will exhaust load-balancer socket connections. [ ] 5. Automated Canary Gating (Halt on DNS/Mesh Latency): Configure your progressive delivery controllers (Argo Rollouts, Flagger) to halt canary progression not just on HTTP 5xx codes, but on proxy latency spikes, upstream connection drops, or CoreDNS query latency. Discussion Question When you roll out major cluster updates or large-scale deployments, how does your team protect against sidecar/proxy throttling and retry storms? Do you rely on automated canary rollouts, strict PDBs, or dedicated node pools for critical platform gateways? CTA (Share Deployment Experiences) Drop your war stories below! What was the sneakisiest deployment failure or cascading cluster outage you've had to debug in production, and what guardrail did you install to make sure it never happens again?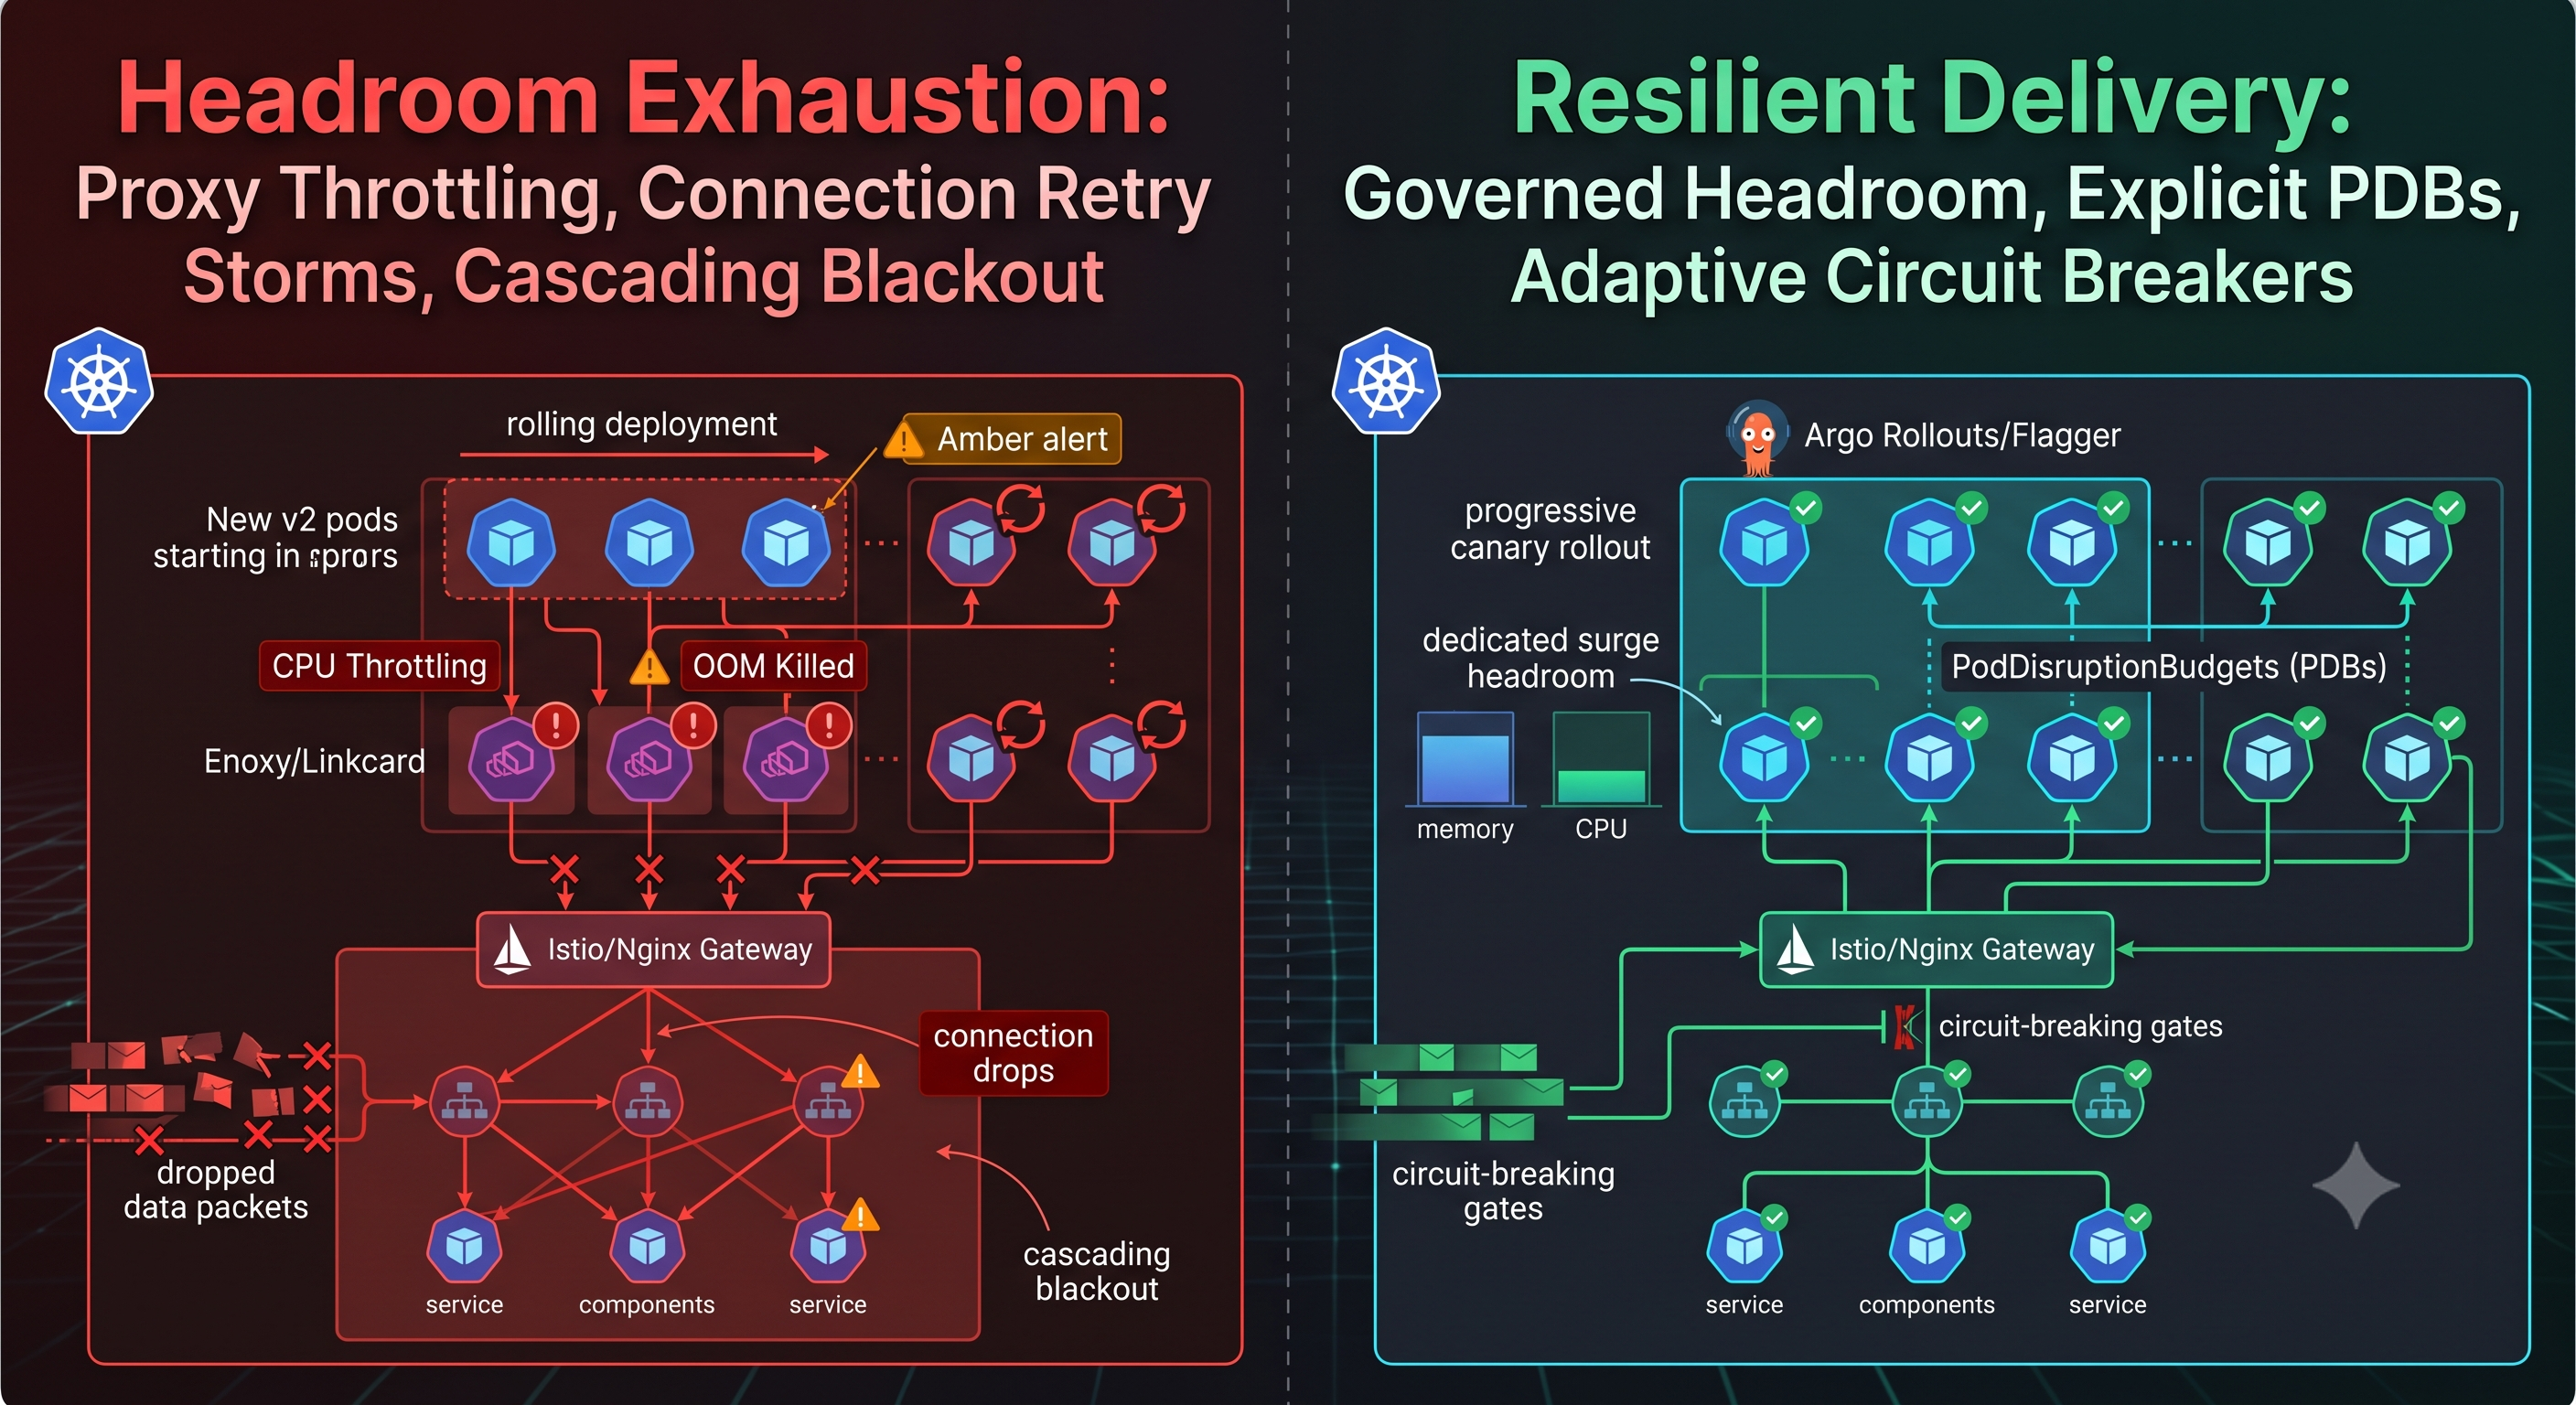 0 Comments 0 Shares 4 Views 0 Reviews
 -
The GitOps Drift Challenge: What Happens When You Bypass Your CI/CD Pipeline During a P1 Outage?
GitOps creates an immaculate single source of truth—until production reality clashes with theoretical purity. When an incident strikes, engineering teams typically fall into one of two traps:
1. The Reconciliation Overwrite Trap
A developer manually scales up a replica set or tweaks environment variables directly in the cluster to mitigate an outage. Three minutes later, Argo CD or Flux runs its reconciliation cycle, detects that live state does not match the Git repository, and silently rolls the hotfix back to the broken state, re-triggering the outage.
2. The Unrecorded Drift Debt
To prevent the auto-revert, the on-call engineer disables automated sync or suspends the application. The incident is resolved, everyone goes back to sleep, and the cluster remains untracked. Three weeks later, an unrelated routine merge re-enables sync, clobbering the live patch and causing an unexplained regression.
The 3-Step Architectural Challenge for Your Stack
Instead of pretending manual hotfixes never happen, resilient platforms design for emergency drift by default:
Automated Reverse-Syncing: If an emergency mutation occurs in the cluster, does your tooling alert on drift and automatically open a reverse pull request to capture the live state into Git?
Break-Glass Ephemeral Access: Do your engineers hold permanent write access to production namespaces, or do you enforce time-boxed, auto-expiring elevated roles with mandatory post-incident audit webhooks?
Graceful Suspension Safeguards: When an application sync is manually paused during an outage, is there an automated ticket or Slack alert tied to your observability stack that blocks future pipeline merges until Git and live state achieve parity?
Key Takeaways
Purity is not resilience: An infrastructure workflow that breaks under incident pressure will inevitably be bypassed by engineers under stress.
Reconciliation can be an adversary: Automated controllers must have clear, incident-aware operational modes to prevent clobbering life-saving emergency hotfixes.
Design for the reconciliation back-channel: High-maturity cloud teams do not ban manual triage; they build automated pipelines that capture emergency drift back into code before the on-call shift ends.
CTA
Be honest: how does your team handle emergency production changes? Do you strictly enforce "Git-only" commits even during active downtime, or do you have a battle-tested break-glass workflow that reconciles manual patches afterward? Share your setup and incident lessons below! 🦅☁️The GitOps Drift Challenge: What Happens When You Bypass Your CI/CD Pipeline During a P1 Outage? GitOps creates an immaculate single source of truth—until production reality clashes with theoretical purity. When an incident strikes, engineering teams typically fall into one of two traps: 1. The Reconciliation Overwrite Trap A developer manually scales up a replica set or tweaks environment variables directly in the cluster to mitigate an outage. Three minutes later, Argo CD or Flux runs its reconciliation cycle, detects that live state does not match the Git repository, and silently rolls the hotfix back to the broken state, re-triggering the outage. 2. The Unrecorded Drift Debt To prevent the auto-revert, the on-call engineer disables automated sync or suspends the application. The incident is resolved, everyone goes back to sleep, and the cluster remains untracked. Three weeks later, an unrelated routine merge re-enables sync, clobbering the live patch and causing an unexplained regression. The 3-Step Architectural Challenge for Your Stack Instead of pretending manual hotfixes never happen, resilient platforms design for emergency drift by default: Automated Reverse-Syncing: If an emergency mutation occurs in the cluster, does your tooling alert on drift and automatically open a reverse pull request to capture the live state into Git? Break-Glass Ephemeral Access: Do your engineers hold permanent write access to production namespaces, or do you enforce time-boxed, auto-expiring elevated roles with mandatory post-incident audit webhooks? Graceful Suspension Safeguards: When an application sync is manually paused during an outage, is there an automated ticket or Slack alert tied to your observability stack that blocks future pipeline merges until Git and live state achieve parity? Key Takeaways Purity is not resilience: An infrastructure workflow that breaks under incident pressure will inevitably be bypassed by engineers under stress. Reconciliation can be an adversary: Automated controllers must have clear, incident-aware operational modes to prevent clobbering life-saving emergency hotfixes. Design for the reconciliation back-channel: High-maturity cloud teams do not ban manual triage; they build automated pipelines that capture emergency drift back into code before the on-call shift ends. CTA Be honest: how does your team handle emergency production changes? Do you strictly enforce "Git-only" commits even during active downtime, or do you have a battle-tested break-glass workflow that reconciles manual patches afterward? Share your setup and incident lessons below! 🦅☁️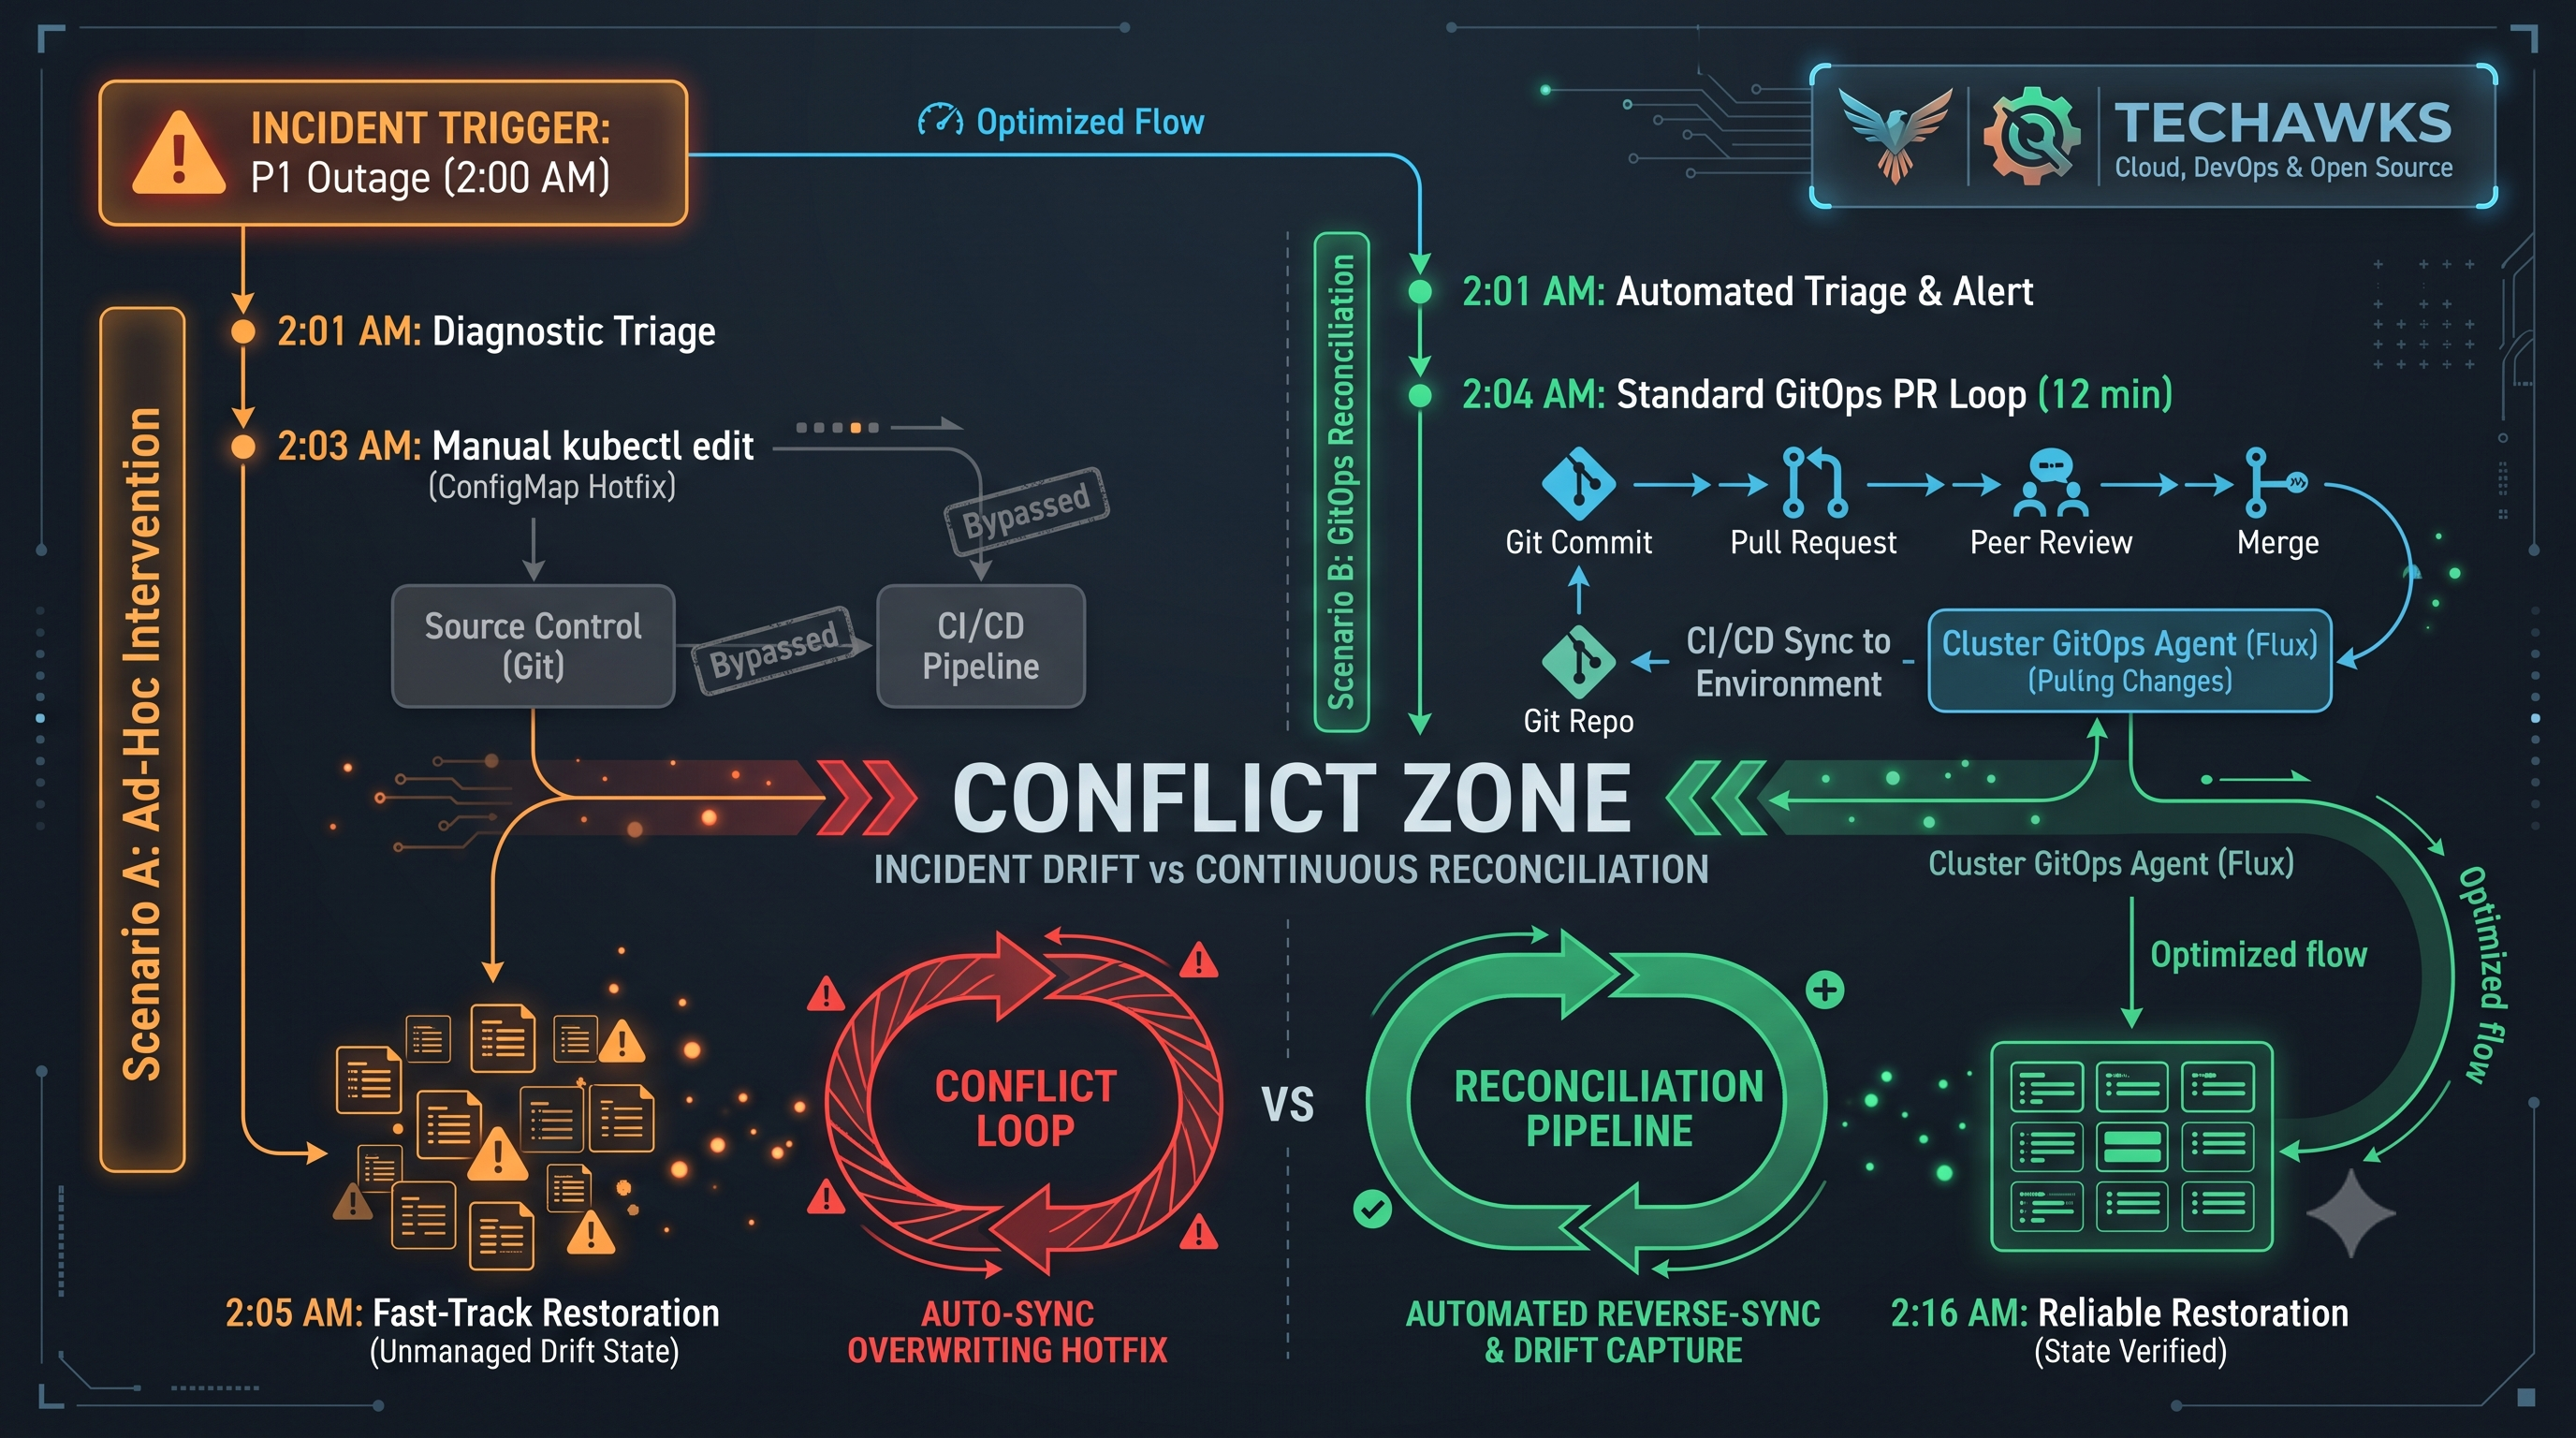 0 Comments 0 Shares 30 Views 0 Reviews
 -
Myth vs Fact: Is Platform Engineering Just Kubernetes with a Nicer Developer Portal?
The shift from traditional DevOps to Platform Engineering is often derailed by treating internal platforms as a software bundle rather than an internal product:
❌ Myth 1: "Installing Backstage or an IDP tool immediately solves developer cognitive load."
The Reality: A portal is just a UI layer; it is not the platform. If clicking "Create New Service" in a developer portal simply generates an uncurated Git repository dumping Helm templates, raw Terraform/OpenTofu files, and complex Ingress controllers into a developer's lap, you haven't eliminated cognitive load—you've merely automated boilerplate delivery. Real platform engineering builds Golden Paths: opinionated, end-to-end paved roads where security defaults, zero-trust RBAC, telemetry probes, and CI/CD pipelines are pre-wired by contract, not configured manually.
❌ Myth 2: "Platform engineering replaces DevOps."
The Reality: Platform engineering doesn't kill DevOps; it operationalizes DevOps principles at scale. In early-stage or small teams, having developers directly manage cloud infrastructure works fine. But as organizations scale beyond 50+ engineers, forcing every product developer to master VPC subnetting, Kubernetes cluster scheduling, and container networking creates catastrophic context switching. Platform engineers operate as an internal SaaS product team—treating application developers as their customers and delivering infrastructure via declarative APIs.
❌ Myth 3: "Every software team needs a dedicated Internal Developer Platform."
The Reality: Over-engineering an IDP for a small team with 5 services is pure architectural vanity. When you have a lean engineering team, lightweight container runtimes (like AWS ECS or serverless containers), standard GitHub Actions workflows, and managed infrastructure-as-code (OpenTofu) deliver 10x more velocity than managing custom Kubernetes control planes, Crossplane compositions, and portal plugins. Platforms only justify their operational overhead when recurring multi-team friction and duplicated infrastructure patterns slow release cycles.
What Actually Delivers Velocity
Self-Service Infrastructure as APIs: Use Kubernetes as a control plane (paired with tools like Crossplane) to expose simplified high-level resource definitions (e.g., kind: DatabaseInstance) rather than forcing devs to touch low-level cloud primitives.
Paved Roads Over Paved Walls: Golden paths should make the secure, compliant, observable way the easiest path to production—while still providing clear escape hatches when specialized workloads require custom tuning.
Product Mindset & Developer Experience (DevEx): Platform teams must measure success through internal developer NPS, lead time to production (from hours to under 30 minutes), and reduction in unplanned toil, not the number of internal portal plugins deployed.
Discussion Question
For the DevOps and cloud engineers in our community: Has your team built or adopted an Internal Developer Platform (IDP)? Are your developers actually self-serving through clear golden paths, or has the platform become another layer of infrastructure that your team has to constantly troubleshoot?
CTA
Share your deployment setups and architectures! Drop your stack in the comments below—whether you're orchestrating via full-blown Kubernetes GitOps (ArgoCD/Flux), lightweight container services, or custom OpenTofu pipelines. Let’s compare platform designs! 🦅☁️Myth vs Fact: Is Platform Engineering Just Kubernetes with a Nicer Developer Portal? The shift from traditional DevOps to Platform Engineering is often derailed by treating internal platforms as a software bundle rather than an internal product: ❌ Myth 1: "Installing Backstage or an IDP tool immediately solves developer cognitive load." The Reality: A portal is just a UI layer; it is not the platform. If clicking "Create New Service" in a developer portal simply generates an uncurated Git repository dumping Helm templates, raw Terraform/OpenTofu files, and complex Ingress controllers into a developer's lap, you haven't eliminated cognitive load—you've merely automated boilerplate delivery. Real platform engineering builds Golden Paths: opinionated, end-to-end paved roads where security defaults, zero-trust RBAC, telemetry probes, and CI/CD pipelines are pre-wired by contract, not configured manually. ❌ Myth 2: "Platform engineering replaces DevOps." The Reality: Platform engineering doesn't kill DevOps; it operationalizes DevOps principles at scale. In early-stage or small teams, having developers directly manage cloud infrastructure works fine. But as organizations scale beyond 50+ engineers, forcing every product developer to master VPC subnetting, Kubernetes cluster scheduling, and container networking creates catastrophic context switching. Platform engineers operate as an internal SaaS product team—treating application developers as their customers and delivering infrastructure via declarative APIs. ❌ Myth 3: "Every software team needs a dedicated Internal Developer Platform." The Reality: Over-engineering an IDP for a small team with 5 services is pure architectural vanity. When you have a lean engineering team, lightweight container runtimes (like AWS ECS or serverless containers), standard GitHub Actions workflows, and managed infrastructure-as-code (OpenTofu) deliver 10x more velocity than managing custom Kubernetes control planes, Crossplane compositions, and portal plugins. Platforms only justify their operational overhead when recurring multi-team friction and duplicated infrastructure patterns slow release cycles. What Actually Delivers Velocity Self-Service Infrastructure as APIs: Use Kubernetes as a control plane (paired with tools like Crossplane) to expose simplified high-level resource definitions (e.g., kind: DatabaseInstance) rather than forcing devs to touch low-level cloud primitives. Paved Roads Over Paved Walls: Golden paths should make the secure, compliant, observable way the easiest path to production—while still providing clear escape hatches when specialized workloads require custom tuning. Product Mindset & Developer Experience (DevEx): Platform teams must measure success through internal developer NPS, lead time to production (from hours to under 30 minutes), and reduction in unplanned toil, not the number of internal portal plugins deployed. Discussion Question For the DevOps and cloud engineers in our community: Has your team built or adopted an Internal Developer Platform (IDP)? Are your developers actually self-serving through clear golden paths, or has the platform become another layer of infrastructure that your team has to constantly troubleshoot? CTA Share your deployment setups and architectures! Drop your stack in the comments below—whether you're orchestrating via full-blown Kubernetes GitOps (ArgoCD/Flux), lightweight container services, or custom OpenTofu pipelines. Let’s compare platform designs! 🦅☁️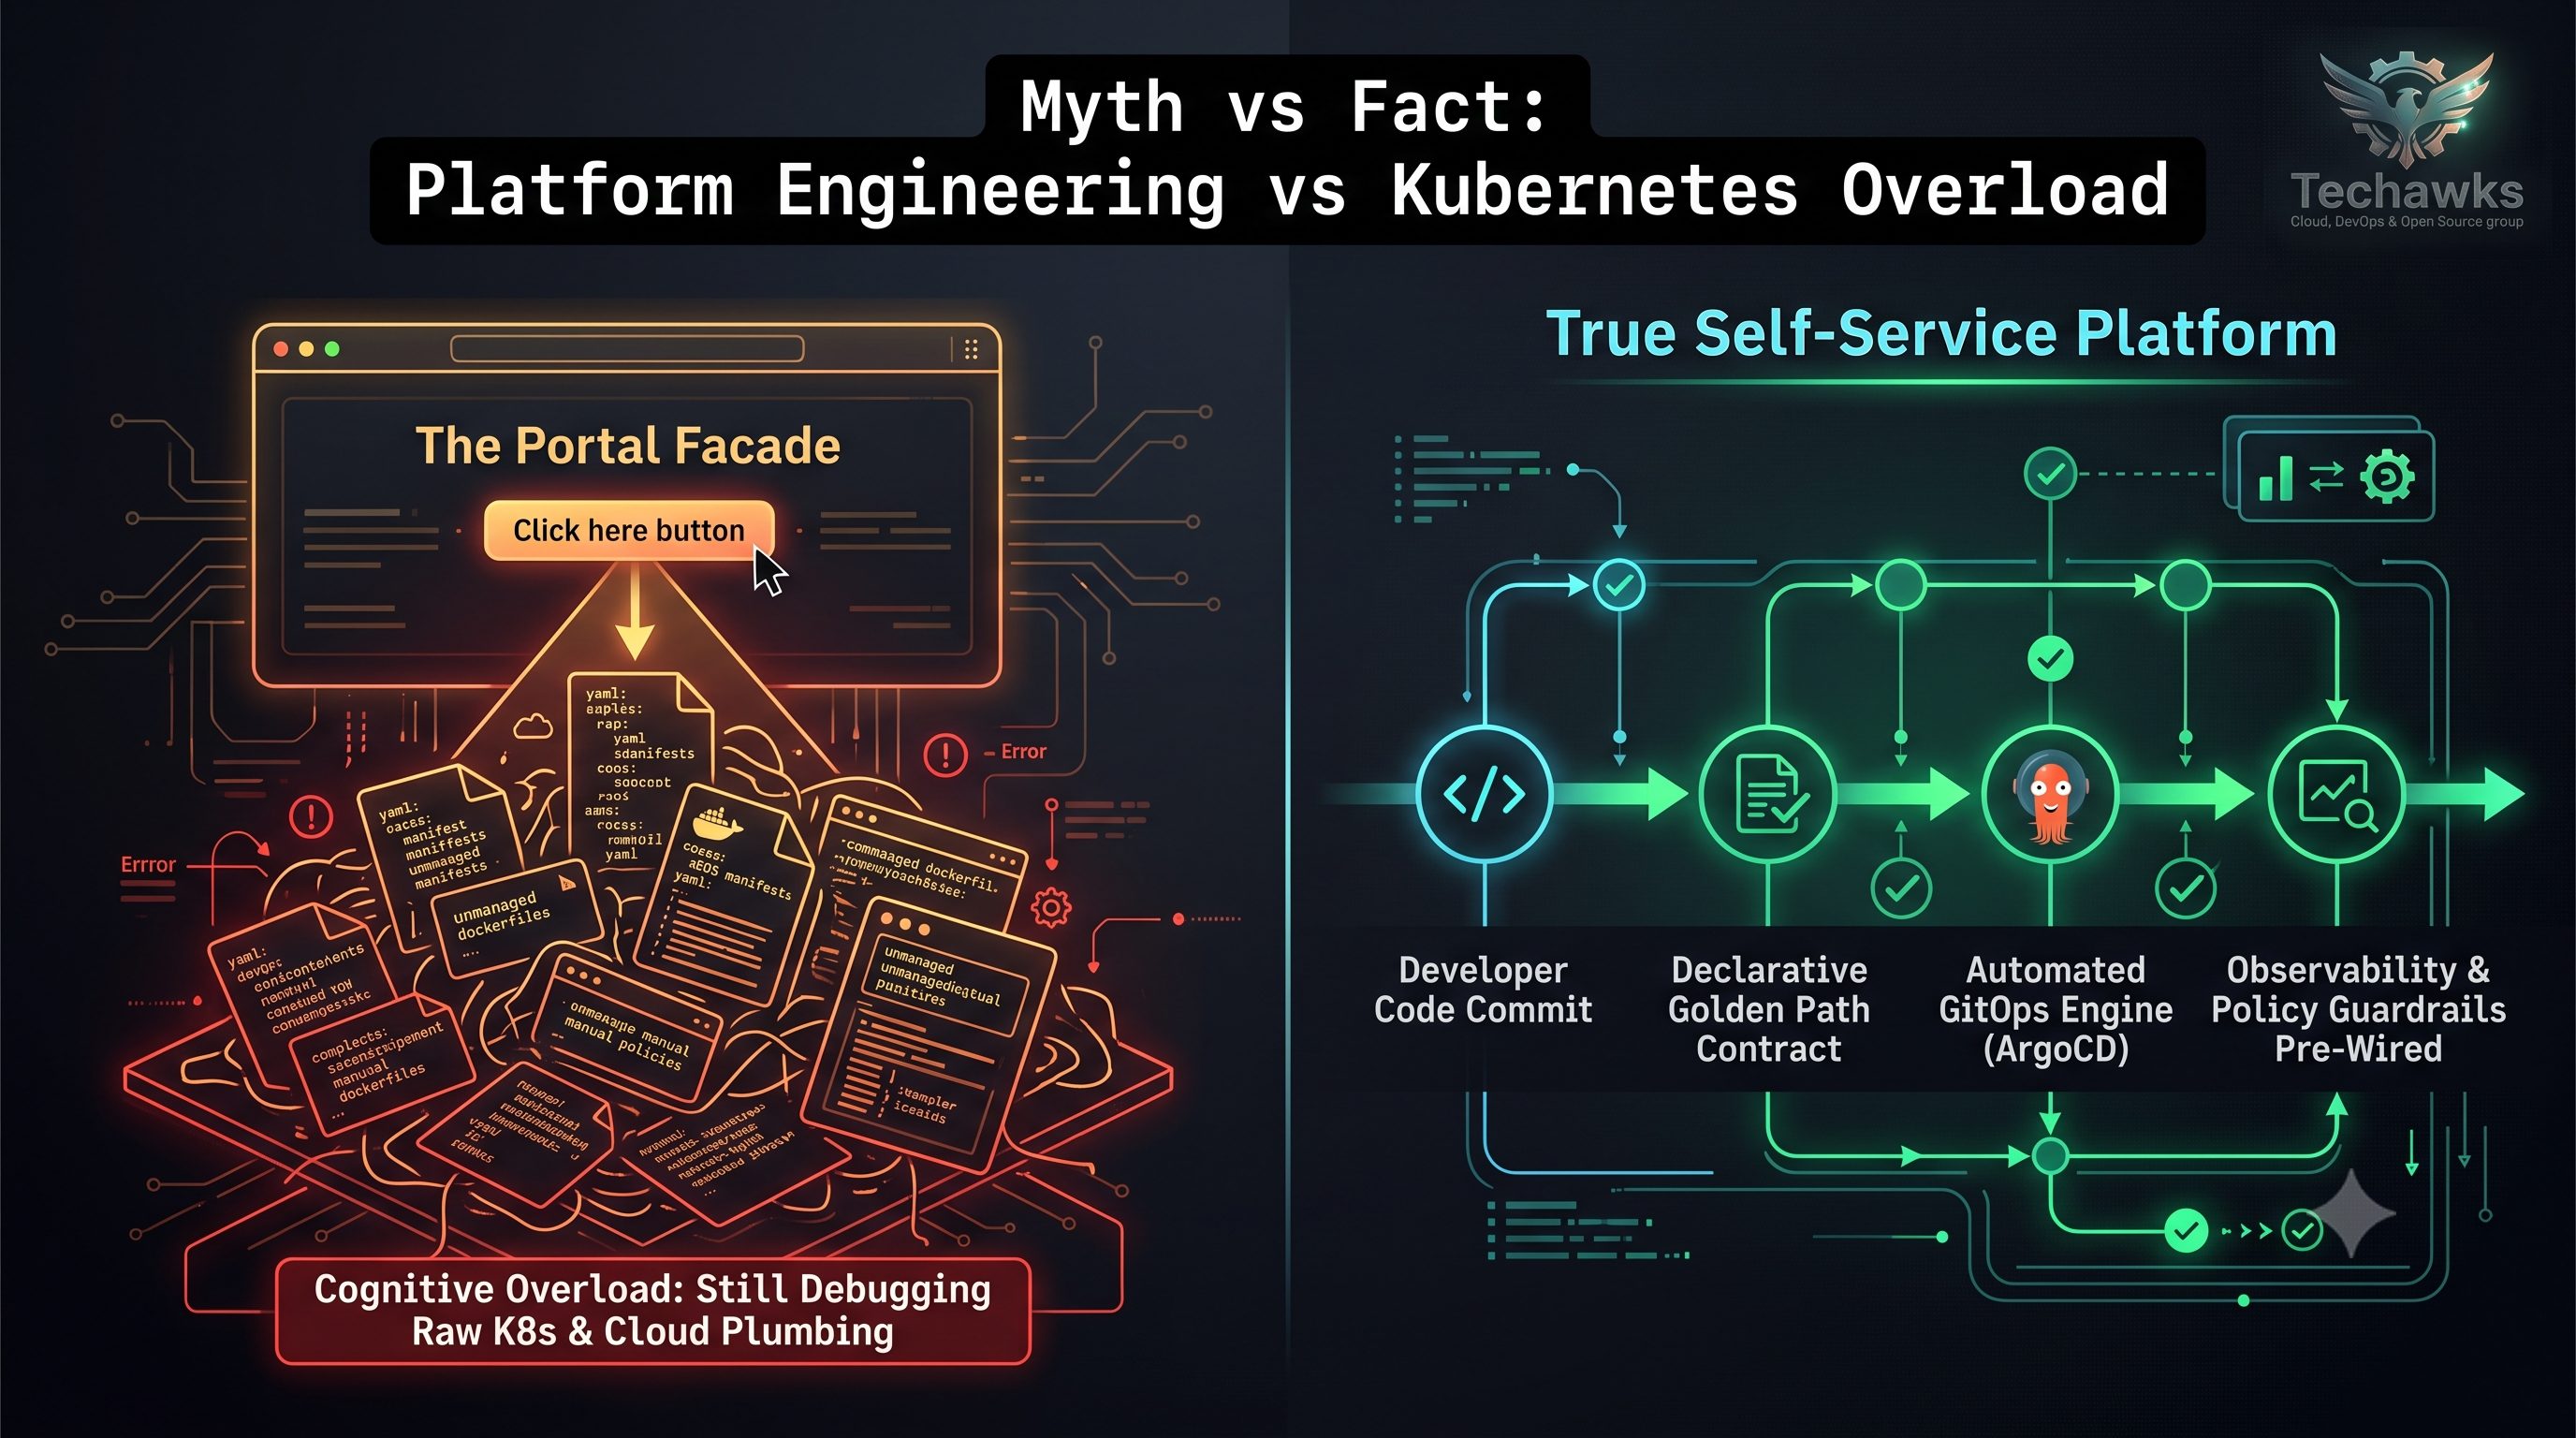 0 Comments 0 Shares 26 Views 0 Reviews
 -
Tool Review: OpenTofu vs. Terraform—Is the Fork Worth the Migration Overhead?
OpenTofu was launched as a Linux Foundation-backed, open-source fork of Terraform, preserving the MPL-2.0 spirit while ensuring community-driven evolution. For most teams, day-to-day Infrastructure as Code (IaC) syntax looks nearly identical, but the architectural divergence under the hood is beginning to compound.
Where OpenTofu Excels:
Truly Open Governance: Governed by the Linux Foundation, OpenTofu guarantees that roadmap priorities, provider registries, and core engine patches remain neutral and unencumbered by restrictive licensing terms.
State File Encryption: OpenTofu introduced native client-side state file encryption at rest (supporting AWS KMS, GCP KMS, and Azure Key Vault), resolving a long-standing vulnerability in core Terraform where sensitive secrets sat unencrypted in state files.
Drop-in Compatibility: For teams running standard configurations, OpenTofu functions as an exact binary replacement (tofu init, tofu plan, tofu apply) with zero code refactoring required for pre-1.6 Terraform modules.
Where Engineering Teams Face Friction:
Ecosystem Parity & Proprietary Provider Drift: As enterprise features diverge, providers optimized specifically for commercial cloud platforms or proprietary orchestration runtimes may lag in official support or require community-maintained mirrors.
Pipeline Tooling Re-certification: Migrating isn’t just swapping a binary; it requires updating CI/CD runners, drift detection agents, security linters (like tfsec or Checkov), and wrapper platforms across your deployment ecosystem.
Organizational Conservatism: In enterprise environments, risk-averse security and compliance boards often prefer incumbent commercial SLAs over community foundation backing, regardless of technical merits.
Key Takeaways
State security is the differentiator: OpenTofu's native client-side state encryption alone solves a major compliance headache without requiring external secret-masking wrappers.
Migration risk is low, validation cost is real: The binary swap is trivial; the actual effort lies in testing your automated CI/CD pipelines, linting tools, and custom provider registries.
Forks eventually diverge: While compatibility is near-total today, architectural divergences in module syntax and testing frameworks will force platform teams to choose a long-term path.
CTA (Share deployment experiences)
For DevOps and platform engineers running multi-cloud infrastructure: Has your team migrated production environments to OpenTofu, or are you staying on the Terraform track? If you made the leap, did your automated CI/CD pipelines hit any unexpected provider registry roadblocks? Share your real-world deployment lessons below.Tool Review: OpenTofu vs. Terraform—Is the Fork Worth the Migration Overhead? OpenTofu was launched as a Linux Foundation-backed, open-source fork of Terraform, preserving the MPL-2.0 spirit while ensuring community-driven evolution. For most teams, day-to-day Infrastructure as Code (IaC) syntax looks nearly identical, but the architectural divergence under the hood is beginning to compound. Where OpenTofu Excels: Truly Open Governance: Governed by the Linux Foundation, OpenTofu guarantees that roadmap priorities, provider registries, and core engine patches remain neutral and unencumbered by restrictive licensing terms. State File Encryption: OpenTofu introduced native client-side state file encryption at rest (supporting AWS KMS, GCP KMS, and Azure Key Vault), resolving a long-standing vulnerability in core Terraform where sensitive secrets sat unencrypted in state files. Drop-in Compatibility: For teams running standard configurations, OpenTofu functions as an exact binary replacement (tofu init, tofu plan, tofu apply) with zero code refactoring required for pre-1.6 Terraform modules. Where Engineering Teams Face Friction: Ecosystem Parity & Proprietary Provider Drift: As enterprise features diverge, providers optimized specifically for commercial cloud platforms or proprietary orchestration runtimes may lag in official support or require community-maintained mirrors. Pipeline Tooling Re-certification: Migrating isn’t just swapping a binary; it requires updating CI/CD runners, drift detection agents, security linters (like tfsec or Checkov), and wrapper platforms across your deployment ecosystem. Organizational Conservatism: In enterprise environments, risk-averse security and compliance boards often prefer incumbent commercial SLAs over community foundation backing, regardless of technical merits. Key Takeaways State security is the differentiator: OpenTofu's native client-side state encryption alone solves a major compliance headache without requiring external secret-masking wrappers. Migration risk is low, validation cost is real: The binary swap is trivial; the actual effort lies in testing your automated CI/CD pipelines, linting tools, and custom provider registries. Forks eventually diverge: While compatibility is near-total today, architectural divergences in module syntax and testing frameworks will force platform teams to choose a long-term path. CTA (Share deployment experiences) For DevOps and platform engineers running multi-cloud infrastructure: Has your team migrated production environments to OpenTofu, or are you staying on the Terraform track? If you made the leap, did your automated CI/CD pipelines hit any unexpected provider registry roadblocks? Share your real-world deployment lessons below.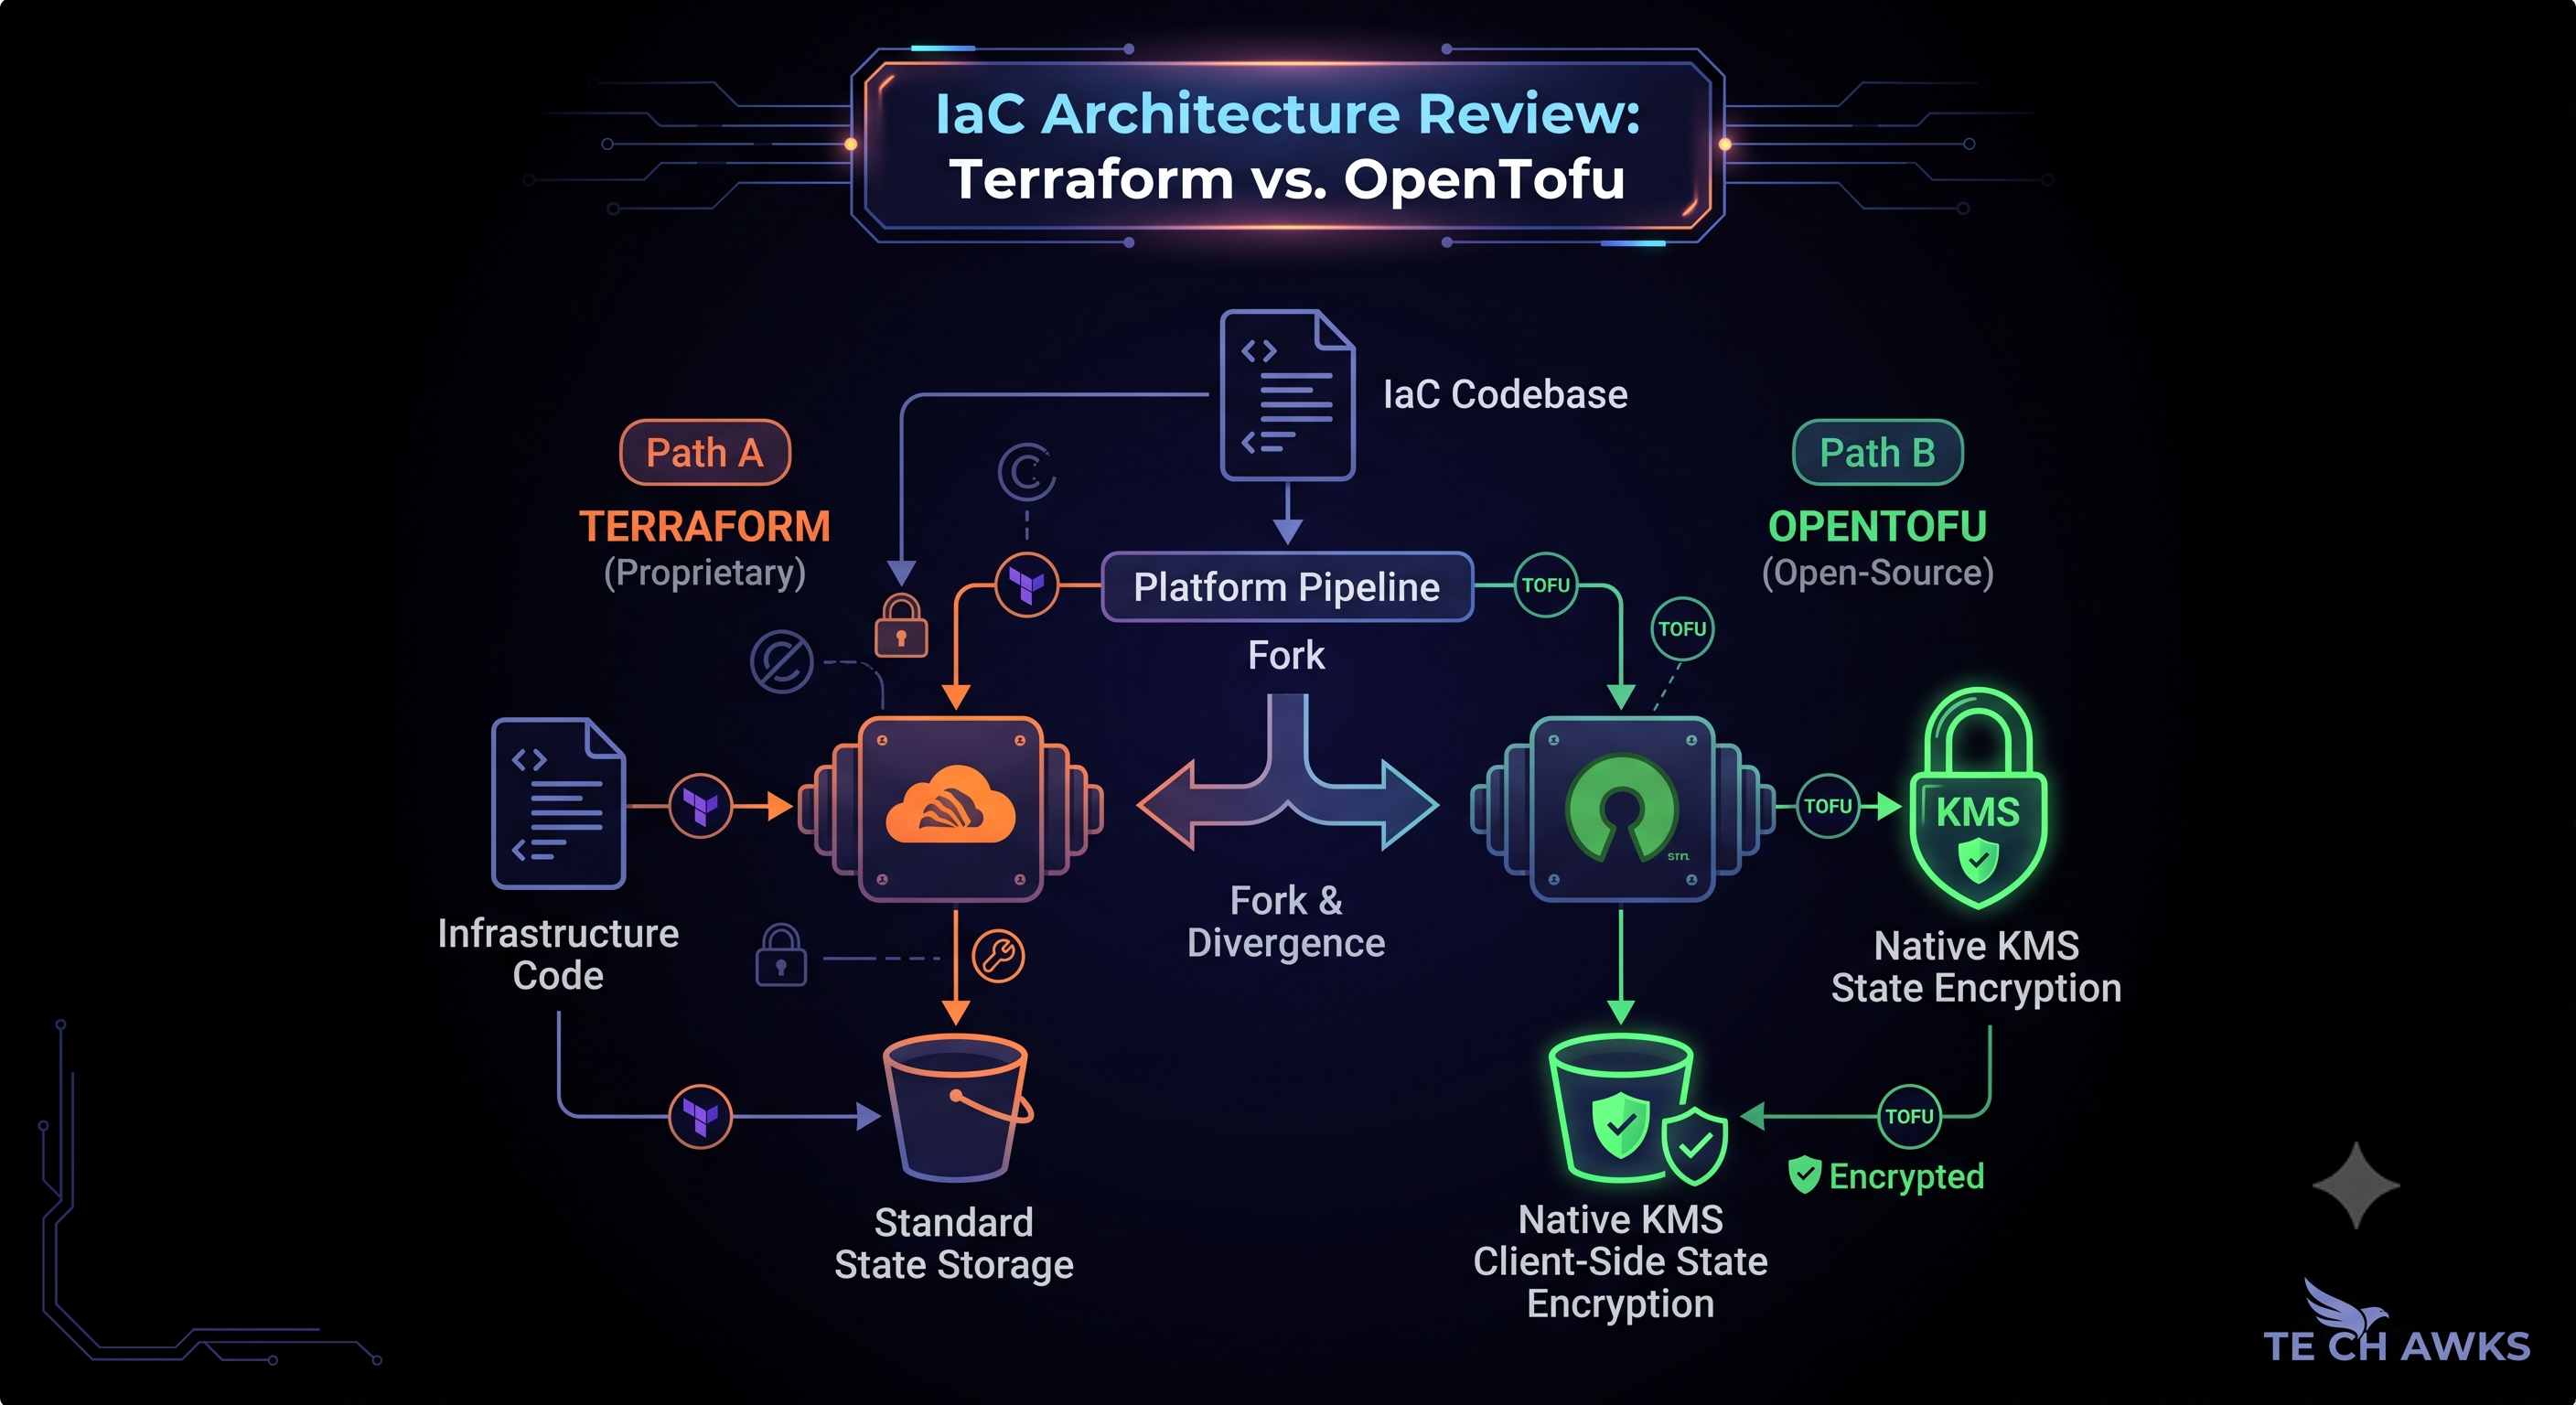 0 Comments 0 Shares 98 Views 0 Reviews
 -
Stop Writing YAML from Scratch: Why Platform Engineering Is Swallowing Traditional DevOps
For years, the DevOps industry operated under a broken promise: "You build it, you run it." In practice, that dumped dozens of disparate tools—Kubernetes, CI/CD runners, secret managers, security scanners, and cloud IAM policies—straight onto feature developers. The outcome wasn't agility; it was cognitive overload and massive tool sprawl.
The cloud ecosystem has decisively moved past ad-hoc pipeline scripting into Internal Developer Platforms (IDPs) and Platform as a Product.
Why This Matters to Your Career
Automation scripts and declarative YAML are now easily synthesized by AI agents and platform orchestrators. The market no longer rewards engineers for manually plumbing infrastructure:
Yesterday's DevOps: Reactive gatekeeper. Writing one-off CI/CD configs, manually troubleshooting broken staging manifests, and approving access requests.
Tomorrow's Platform Engineer: Systems architect. Designing curated "Golden Paths," automated policy guardrails, and self-service abstractions where developers deploy safely without ever having to touch a cluster manifest.
The real leverage has migrated from running infrastructure to designing developer experience and governance systems.
The 3 High-Value Platform Capabilities to Build Now
Curated "Golden Paths" Over Endless Options: Replace custom deployment pipelines with opinionated, standardized templates. High-impact engineers build self-service portals (using frameworks like Backstage or open cloud primitives) that let devs ship to production in minutes with zero guesswork.
Policy-as-Code & Guardrails by Default: Instead of policing PRs manually, enforce security and compliance at runtime and compile time using tools like Open Policy Agent (OPA) or Kyverno. Shift the responsibility from human review to deterministic policy enforcement.
Observability & OpenTelemetry Integration: Raw cluster metrics are noise. Senior cloud engineers wire end-to-end distributed tracing and semantic conventions natively into the platform baseline so teams get instant root-cause diagnostics without configuring monitoring agents from scratch.
Discussion Question
Has your team transitioned toward true self-service platform engineering with governed "golden paths," or are your DevOps engineers still trapped acting as 24/7 infrastructure helpdesks for developers?
CTA
Share your deployment setup and operational reality in the comments. Where are the bottlenecks in your release lifecycle—tool fragmentation, brittle pipelines, or lack of developer self-service? Let's benchmark notes.Stop Writing YAML from Scratch: Why Platform Engineering Is Swallowing Traditional DevOps For years, the DevOps industry operated under a broken promise: "You build it, you run it." In practice, that dumped dozens of disparate tools—Kubernetes, CI/CD runners, secret managers, security scanners, and cloud IAM policies—straight onto feature developers. The outcome wasn't agility; it was cognitive overload and massive tool sprawl. The cloud ecosystem has decisively moved past ad-hoc pipeline scripting into Internal Developer Platforms (IDPs) and Platform as a Product. Why This Matters to Your Career Automation scripts and declarative YAML are now easily synthesized by AI agents and platform orchestrators. The market no longer rewards engineers for manually plumbing infrastructure: Yesterday's DevOps: Reactive gatekeeper. Writing one-off CI/CD configs, manually troubleshooting broken staging manifests, and approving access requests. Tomorrow's Platform Engineer: Systems architect. Designing curated "Golden Paths," automated policy guardrails, and self-service abstractions where developers deploy safely without ever having to touch a cluster manifest. The real leverage has migrated from running infrastructure to designing developer experience and governance systems. The 3 High-Value Platform Capabilities to Build Now Curated "Golden Paths" Over Endless Options: Replace custom deployment pipelines with opinionated, standardized templates. High-impact engineers build self-service portals (using frameworks like Backstage or open cloud primitives) that let devs ship to production in minutes with zero guesswork. Policy-as-Code & Guardrails by Default: Instead of policing PRs manually, enforce security and compliance at runtime and compile time using tools like Open Policy Agent (OPA) or Kyverno. Shift the responsibility from human review to deterministic policy enforcement. Observability & OpenTelemetry Integration: Raw cluster metrics are noise. Senior cloud engineers wire end-to-end distributed tracing and semantic conventions natively into the platform baseline so teams get instant root-cause diagnostics without configuring monitoring agents from scratch. Discussion Question Has your team transitioned toward true self-service platform engineering with governed "golden paths," or are your DevOps engineers still trapped acting as 24/7 infrastructure helpdesks for developers? CTA Share your deployment setup and operational reality in the comments. Where are the bottlenecks in your release lifecycle—tool fragmentation, brittle pipelines, or lack of developer self-service? Let's benchmark notes.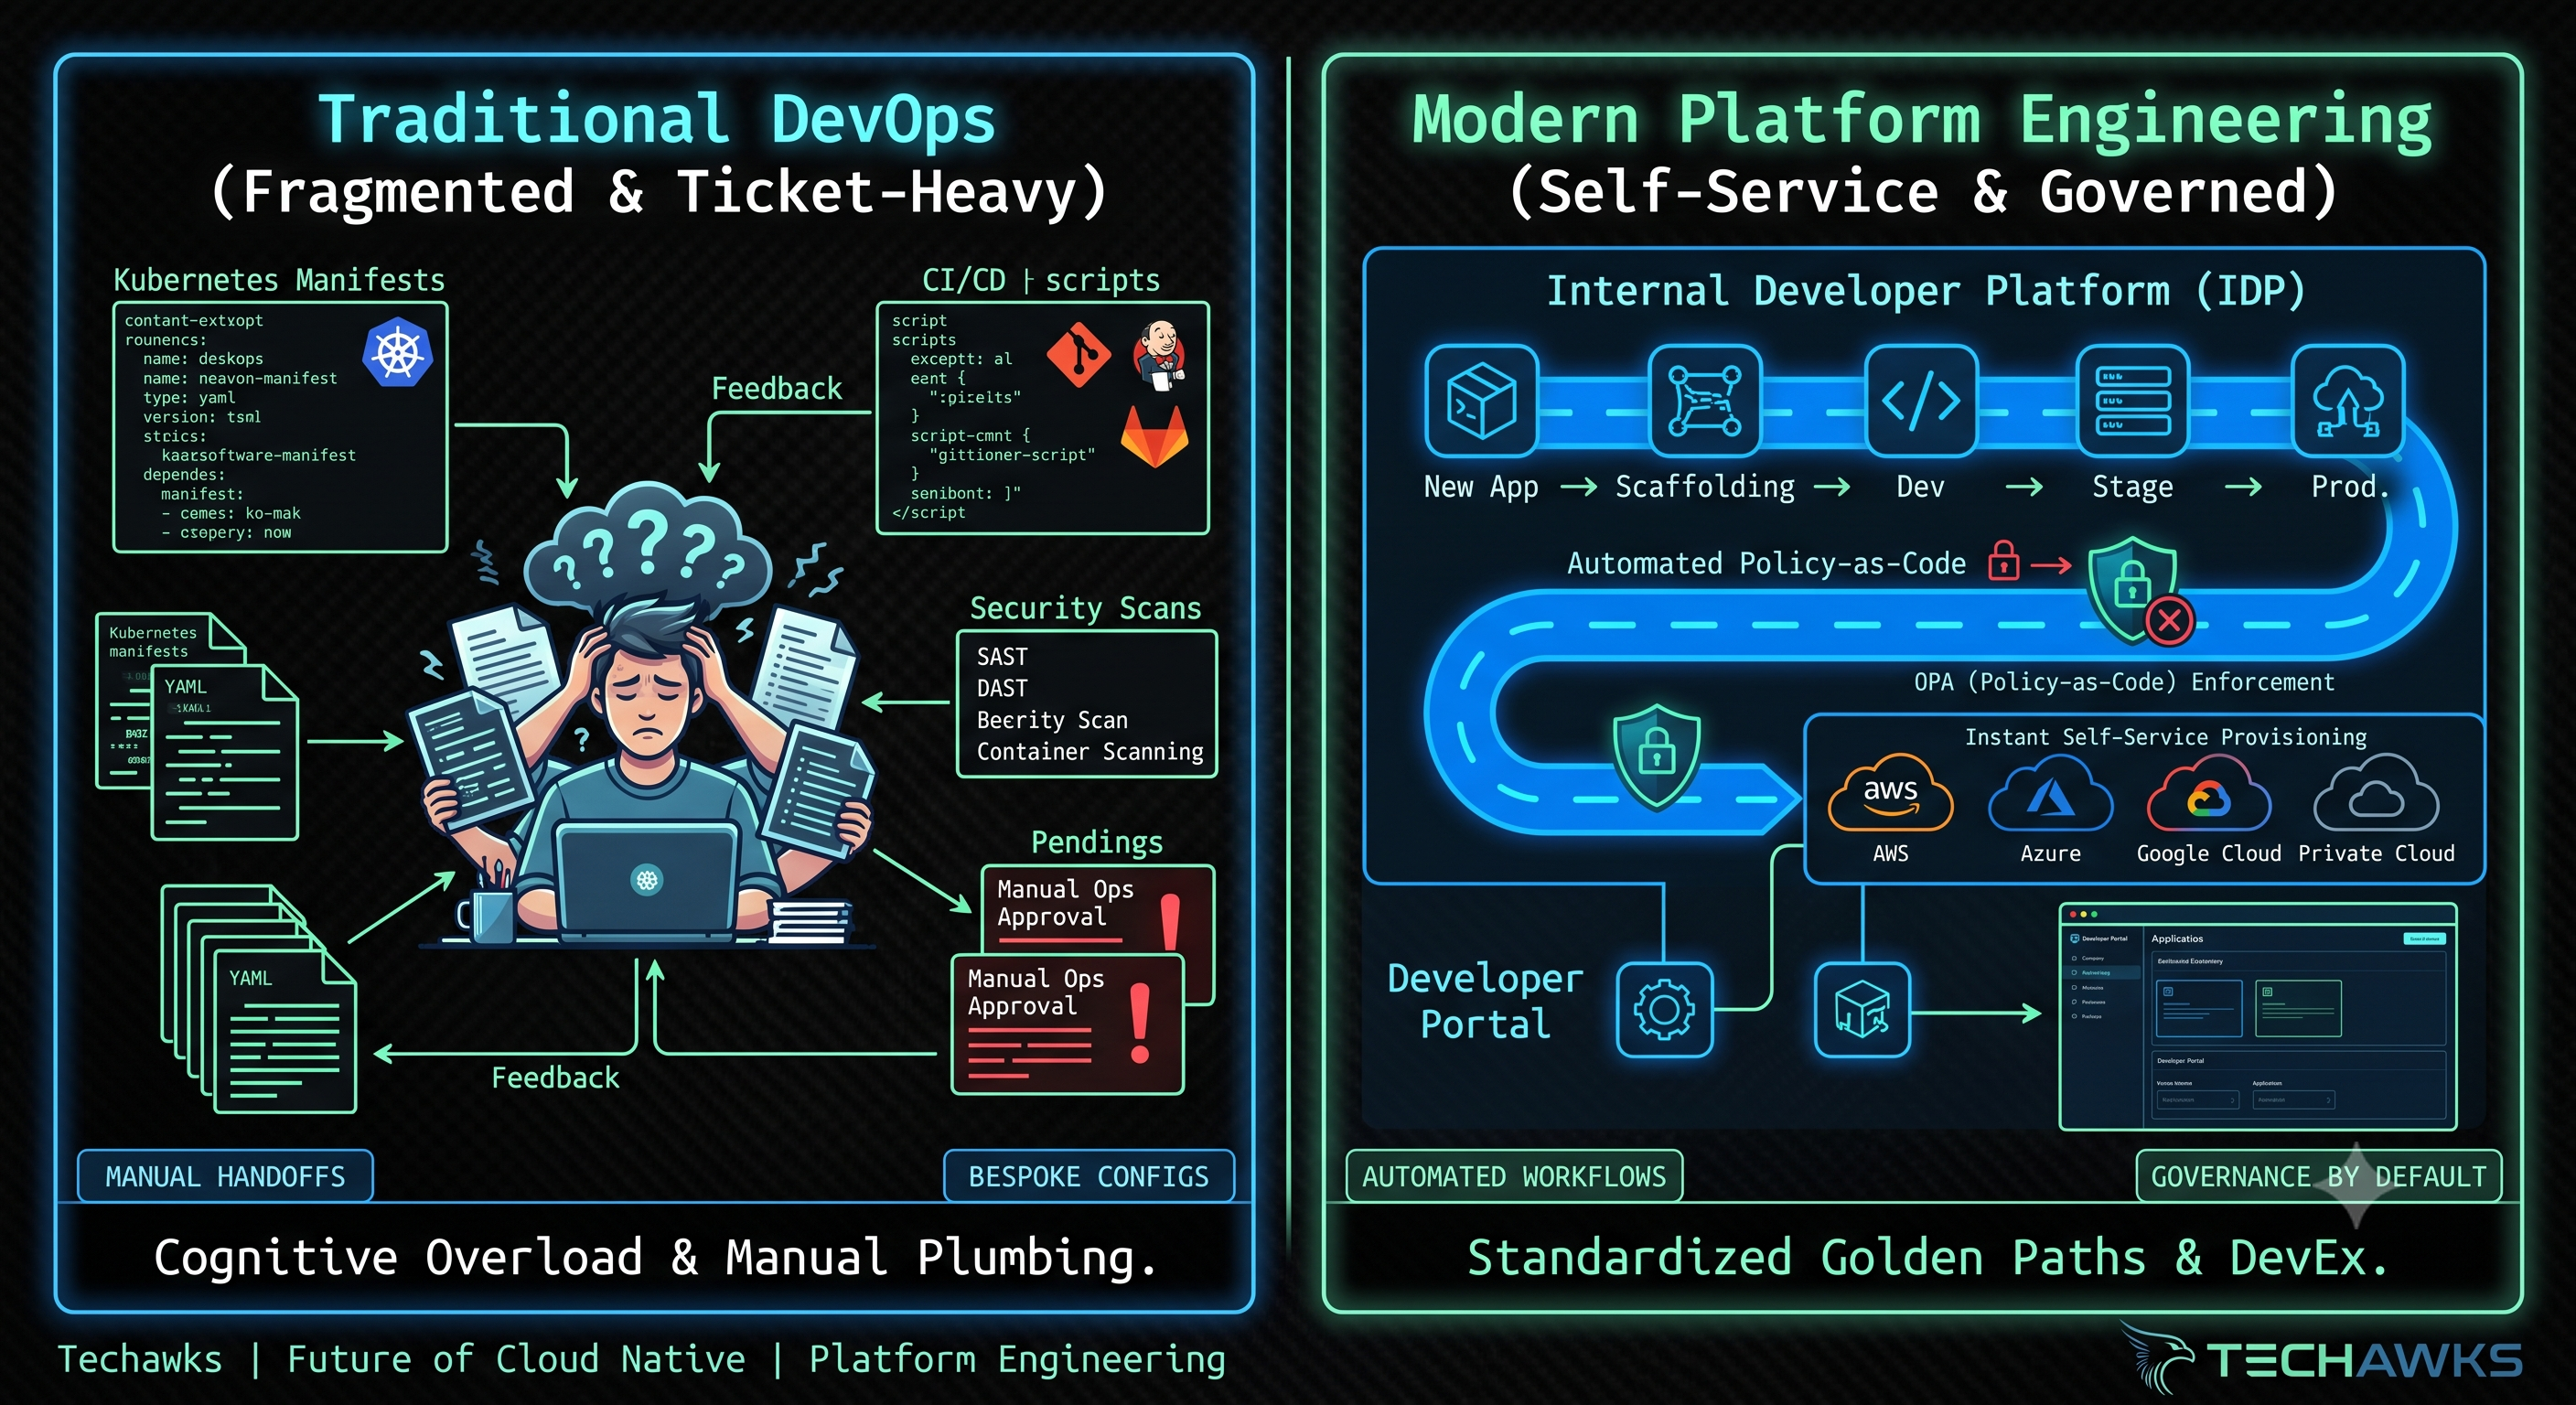 0 Comments 0 Shares 57 Views 0 Reviews
 -
Where does your deployment pipeline actually break when things go sideways?
Every team aims for boring, fully automated releases. In practice, between multi-cloud dependencies, stateful services, and microservice sprawl, deployments rarely fail where you expect them to.
Cast your vote below on what triggers the most friction or downtime in your release process:
A) Environment parity drift (differences between staging, dev, and production configurations)
B) Database migrations & stateful rollbacks (schema changes locking tables or failing mid-migration)
C) Secret & configuration mismanagement (expired tokens, wrong environment variables, or IAM role drift)
D) Flaky integration/end-to-end tests (false positives that mask actual breaking bugs)
Select your vote above, then head into the comments. What was the most elusive bug or failure that slipped past your CI/CD checks straight into production?
Key Takeaways
Parity is an ongoing audit: Containers solve runtime consistency, but configuration, IAM permissions, and network policies still drift without GitOps enforcement.
Decouple migrations from application releases: Expand-and-contract patterns for database schemas prevent catastrophic rollbacks during service updates.
Automation requires confidence: Flaky tests breed alert fatigue; unstable test suites end up ignored rather than fixed.
CTA
Let’s share deployment war stories: What’s your team’s golden rule for deploying to production safely? Do you swear by blue/green cutovers, canary rollouts with automated rollbacks, or feature flags? Drop your deployment strategy below.Where does your deployment pipeline actually break when things go sideways? Every team aims for boring, fully automated releases. In practice, between multi-cloud dependencies, stateful services, and microservice sprawl, deployments rarely fail where you expect them to. Cast your vote below on what triggers the most friction or downtime in your release process: A) Environment parity drift (differences between staging, dev, and production configurations) B) Database migrations & stateful rollbacks (schema changes locking tables or failing mid-migration) C) Secret & configuration mismanagement (expired tokens, wrong environment variables, or IAM role drift) D) Flaky integration/end-to-end tests (false positives that mask actual breaking bugs) Select your vote above, then head into the comments. What was the most elusive bug or failure that slipped past your CI/CD checks straight into production? Key Takeaways Parity is an ongoing audit: Containers solve runtime consistency, but configuration, IAM permissions, and network policies still drift without GitOps enforcement. Decouple migrations from application releases: Expand-and-contract patterns for database schemas prevent catastrophic rollbacks during service updates. Automation requires confidence: Flaky tests breed alert fatigue; unstable test suites end up ignored rather than fixed. CTA Let’s share deployment war stories: What’s your team’s golden rule for deploying to production safely? Do you swear by blue/green cutovers, canary rollouts with automated rollbacks, or feature flags? Drop your deployment strategy below.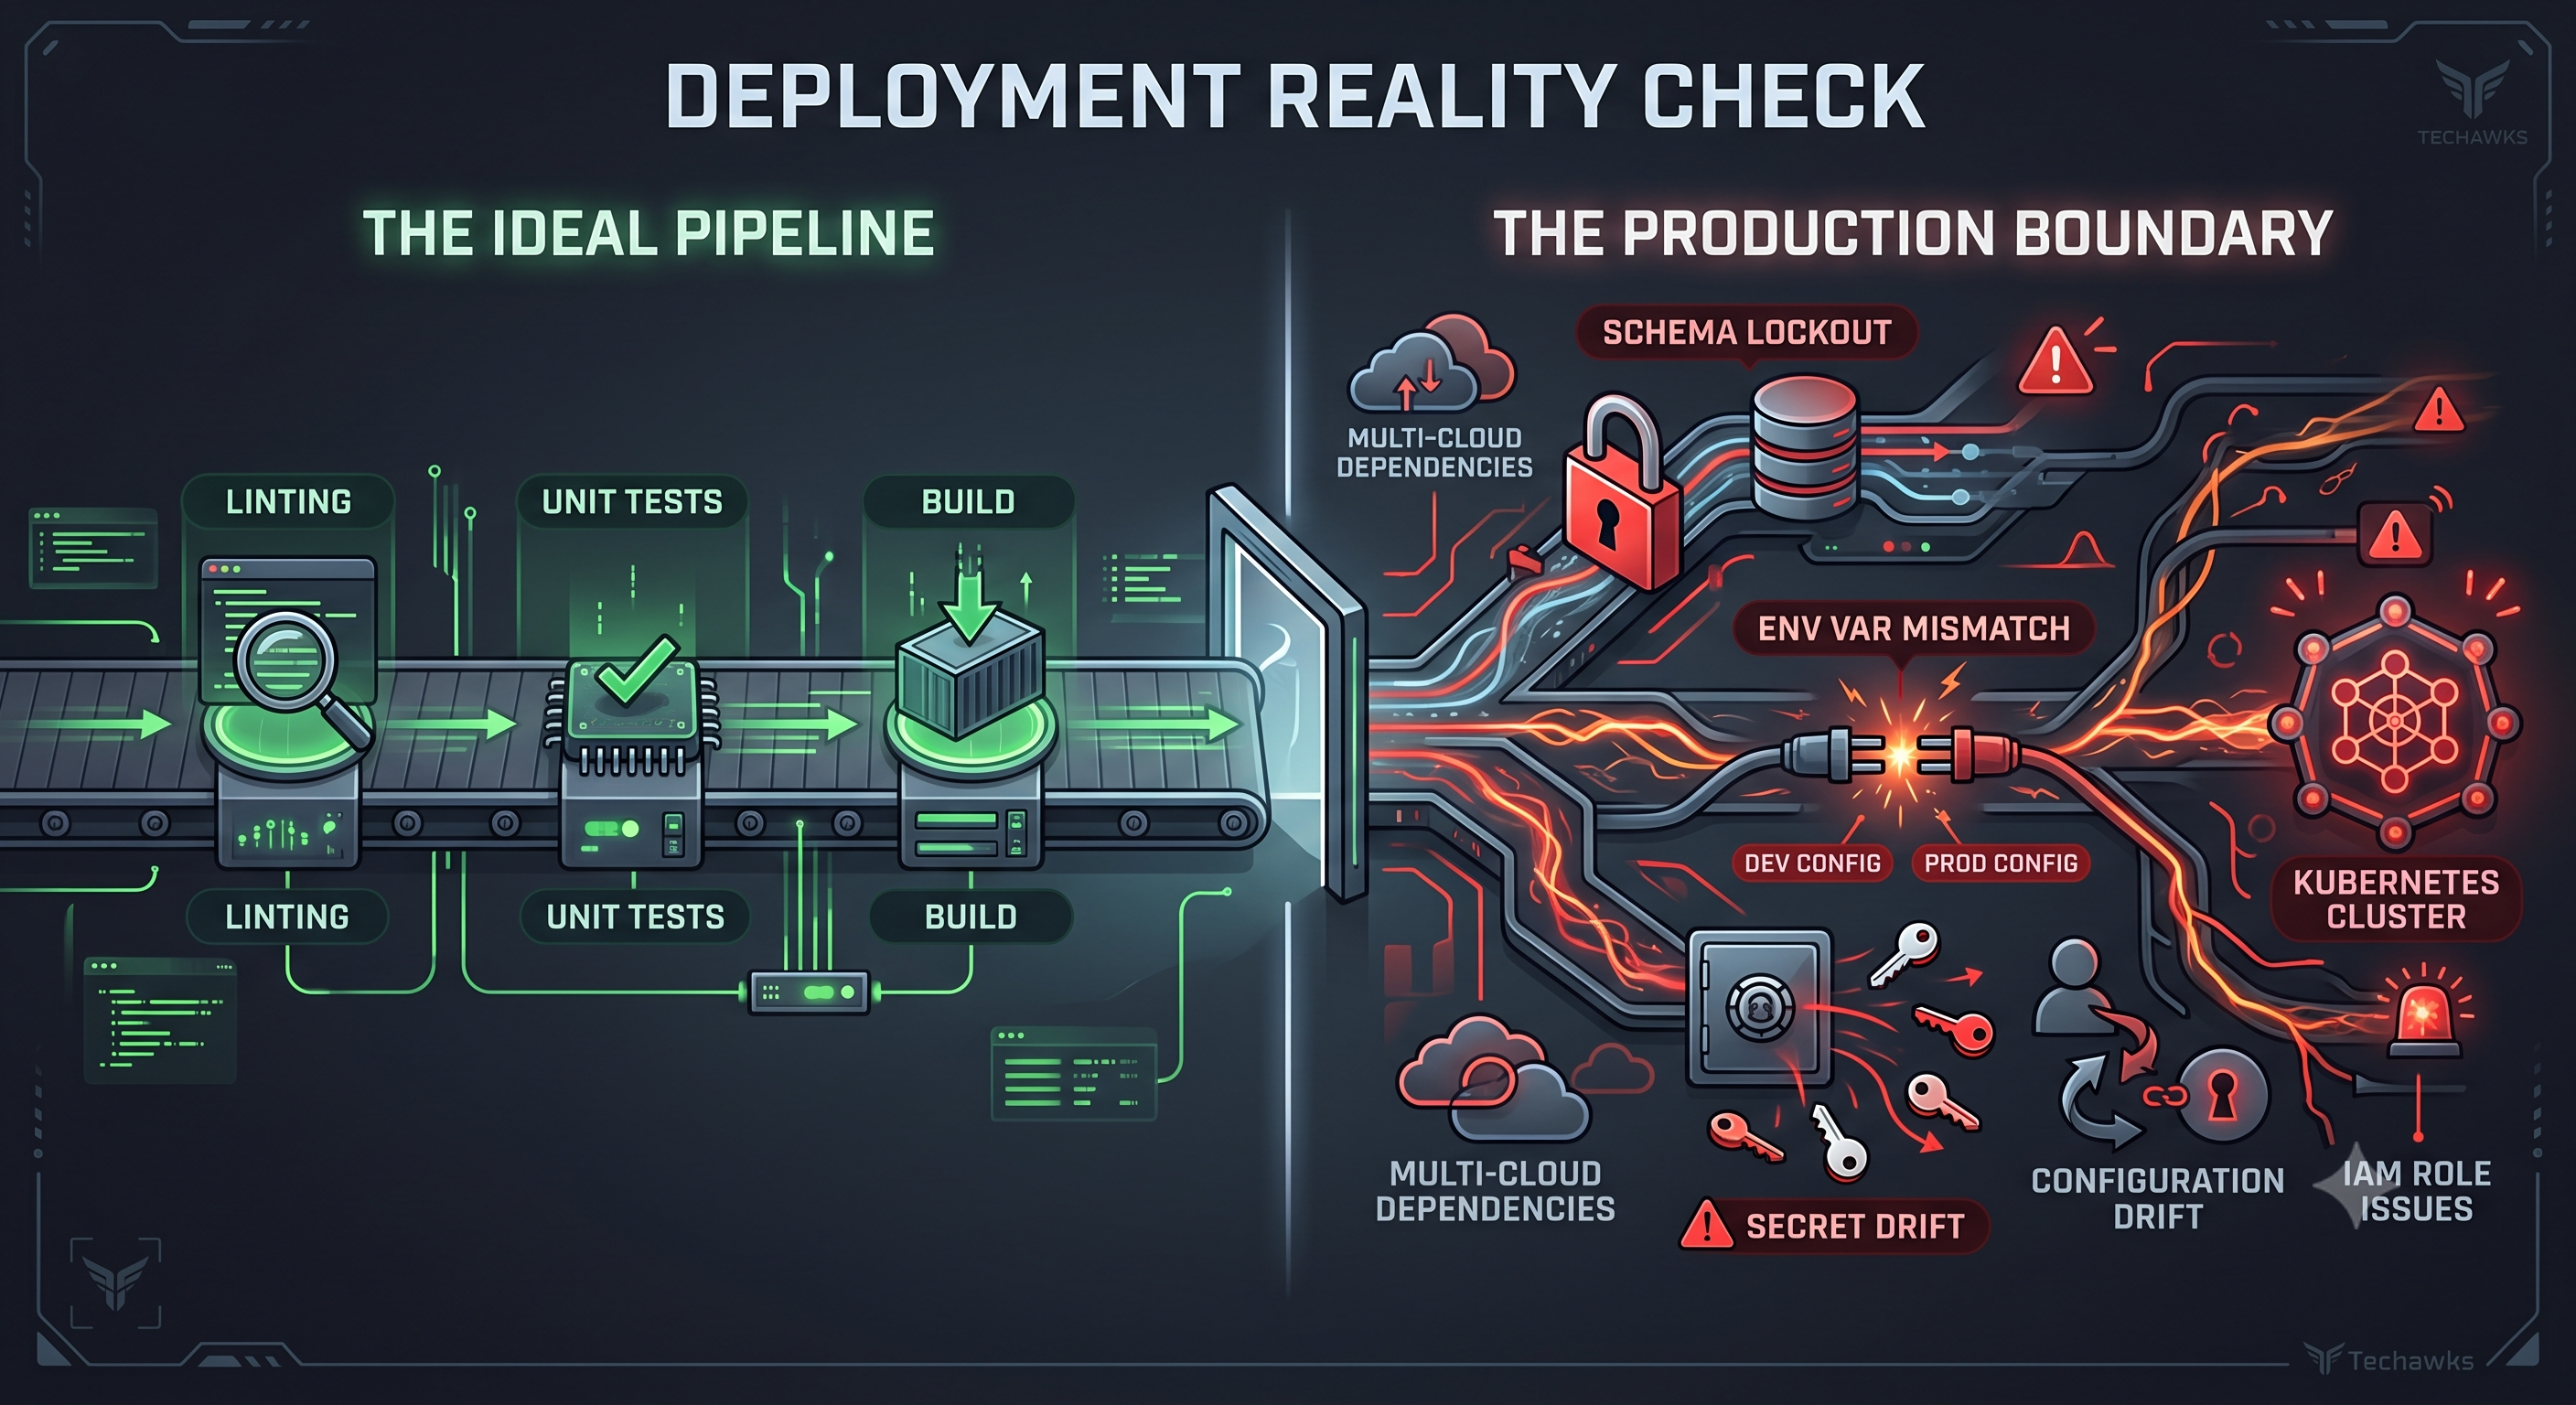 0 Comments 0 Shares 99 Views 0 Reviews
 -
The GitOps Reconciliation Tax: Why Direct Cluster Apply Is Crushing Kubernetes Control Planes
As platforms grow past hundreds of microservices and multi-cluster topologies, the standard GitOps promise—everything declared in Git, reconciled continuously—is running into an architectural bottleneck: the control plane reconciliation storm.
In classical GitOps setups (Argo CD, Flux), controllers continuously compare the live cluster state against the Git repository. When engineering teams scale their custom resources (CRDs), dynamic Helm templating, and automated preview environments, two hidden inefficiencies compound:
The Serialization Bottleneck: A single commit to a monorepo or base directory triggers dozens of reconciler workers to pull manifests, run client-side templating (Kustomize/Helm), and hammer the API server with high-frequency GET and LIST requests to detect drift.
Admission Webhook Cascades: Every synced resource triggers mutating and validating admission webhooks (security scanners, policy-as-code engines like Kyverno/OPA Gatekeeper, and service mesh injectors). Under concurrent sync waves, cluster admission webhooks saturate, driving API request latencies into timeouts.
ETCD Serialization Choke: When hundreds of ephemeral resources churn simultaneously, etcd struggles under heavy writes and watch notifications, degrading cluster scheduling and liveness probes across unrelated production workloads.
Practical Resource: 4 Architectural Tweaks to Tame Sync Thrashing
Decouple Dynamic Templating via OCI Artifact Registries
Stop letting your cluster GitOps agents render complex Helm/Kustomize templates on-the-fly during reconciliation. Render manifests upstream in your CI runner, push pre-baked static manifests as versioned OCI artifacts, and configure your GitOps operator to pull immutable artifacts directly.
Implement Server-Side Apply (SSA) by Default
Switch controllers from standard kubectl apply (client-side three-way merge via last-applied-configuration annotations) to Kubernetes Server-Side Apply. SSA offloads field management directly to the API server, slashing payload size and preventing annotation bloat on large CRDs.
Tune Drift Detection with Webhook-Triggered Syncs
Disable aggressive fixed-interval polling (e.g., polling Git every 60–180 seconds). Rely on Git webhook-driven sync events combined with targeted reconciliation filters (spec.ignoreDifferences) for auto-scaling fields like replicas or dynamic status annotations.
Namespace-Scoped Controllers for Blast-Radius Isolation
Replace monolithic, cluster-wide controller instances with sharded or namespace-scoped operator workers. Isolating high-churn environments (like ephemeral PR preview namespaces) prevents non-production sync spikes from degrading production control planes.
Discussion Question
When scaling GitOps across dozens of clusters or hundreds of microservices, how does your platform team prevent reconciler thrashing and admission webhook latency spikes during high-frequency deploy windows?
CTA (Share deployment experiences)
Share your deployment experiences and architectural war stories below. What strategies or tooling configurations (SSA, custom sync waves, sharding) have made the biggest difference in keeping your cluster API servers healthy?The GitOps Reconciliation Tax: Why Direct Cluster Apply Is Crushing Kubernetes Control Planes As platforms grow past hundreds of microservices and multi-cluster topologies, the standard GitOps promise—everything declared in Git, reconciled continuously—is running into an architectural bottleneck: the control plane reconciliation storm. In classical GitOps setups (Argo CD, Flux), controllers continuously compare the live cluster state against the Git repository. When engineering teams scale their custom resources (CRDs), dynamic Helm templating, and automated preview environments, two hidden inefficiencies compound: The Serialization Bottleneck: A single commit to a monorepo or base directory triggers dozens of reconciler workers to pull manifests, run client-side templating (Kustomize/Helm), and hammer the API server with high-frequency GET and LIST requests to detect drift. Admission Webhook Cascades: Every synced resource triggers mutating and validating admission webhooks (security scanners, policy-as-code engines like Kyverno/OPA Gatekeeper, and service mesh injectors). Under concurrent sync waves, cluster admission webhooks saturate, driving API request latencies into timeouts. ETCD Serialization Choke: When hundreds of ephemeral resources churn simultaneously, etcd struggles under heavy writes and watch notifications, degrading cluster scheduling and liveness probes across unrelated production workloads. Practical Resource: 4 Architectural Tweaks to Tame Sync Thrashing Decouple Dynamic Templating via OCI Artifact Registries Stop letting your cluster GitOps agents render complex Helm/Kustomize templates on-the-fly during reconciliation. Render manifests upstream in your CI runner, push pre-baked static manifests as versioned OCI artifacts, and configure your GitOps operator to pull immutable artifacts directly. Implement Server-Side Apply (SSA) by Default Switch controllers from standard kubectl apply (client-side three-way merge via last-applied-configuration annotations) to Kubernetes Server-Side Apply. SSA offloads field management directly to the API server, slashing payload size and preventing annotation bloat on large CRDs. Tune Drift Detection with Webhook-Triggered Syncs Disable aggressive fixed-interval polling (e.g., polling Git every 60–180 seconds). Rely on Git webhook-driven sync events combined with targeted reconciliation filters (spec.ignoreDifferences) for auto-scaling fields like replicas or dynamic status annotations. Namespace-Scoped Controllers for Blast-Radius Isolation Replace monolithic, cluster-wide controller instances with sharded or namespace-scoped operator workers. Isolating high-churn environments (like ephemeral PR preview namespaces) prevents non-production sync spikes from degrading production control planes. Discussion Question When scaling GitOps across dozens of clusters or hundreds of microservices, how does your platform team prevent reconciler thrashing and admission webhook latency spikes during high-frequency deploy windows? CTA (Share deployment experiences) Share your deployment experiences and architectural war stories below. What strategies or tooling configurations (SSA, custom sync waves, sharding) have made the biggest difference in keeping your cluster API servers healthy?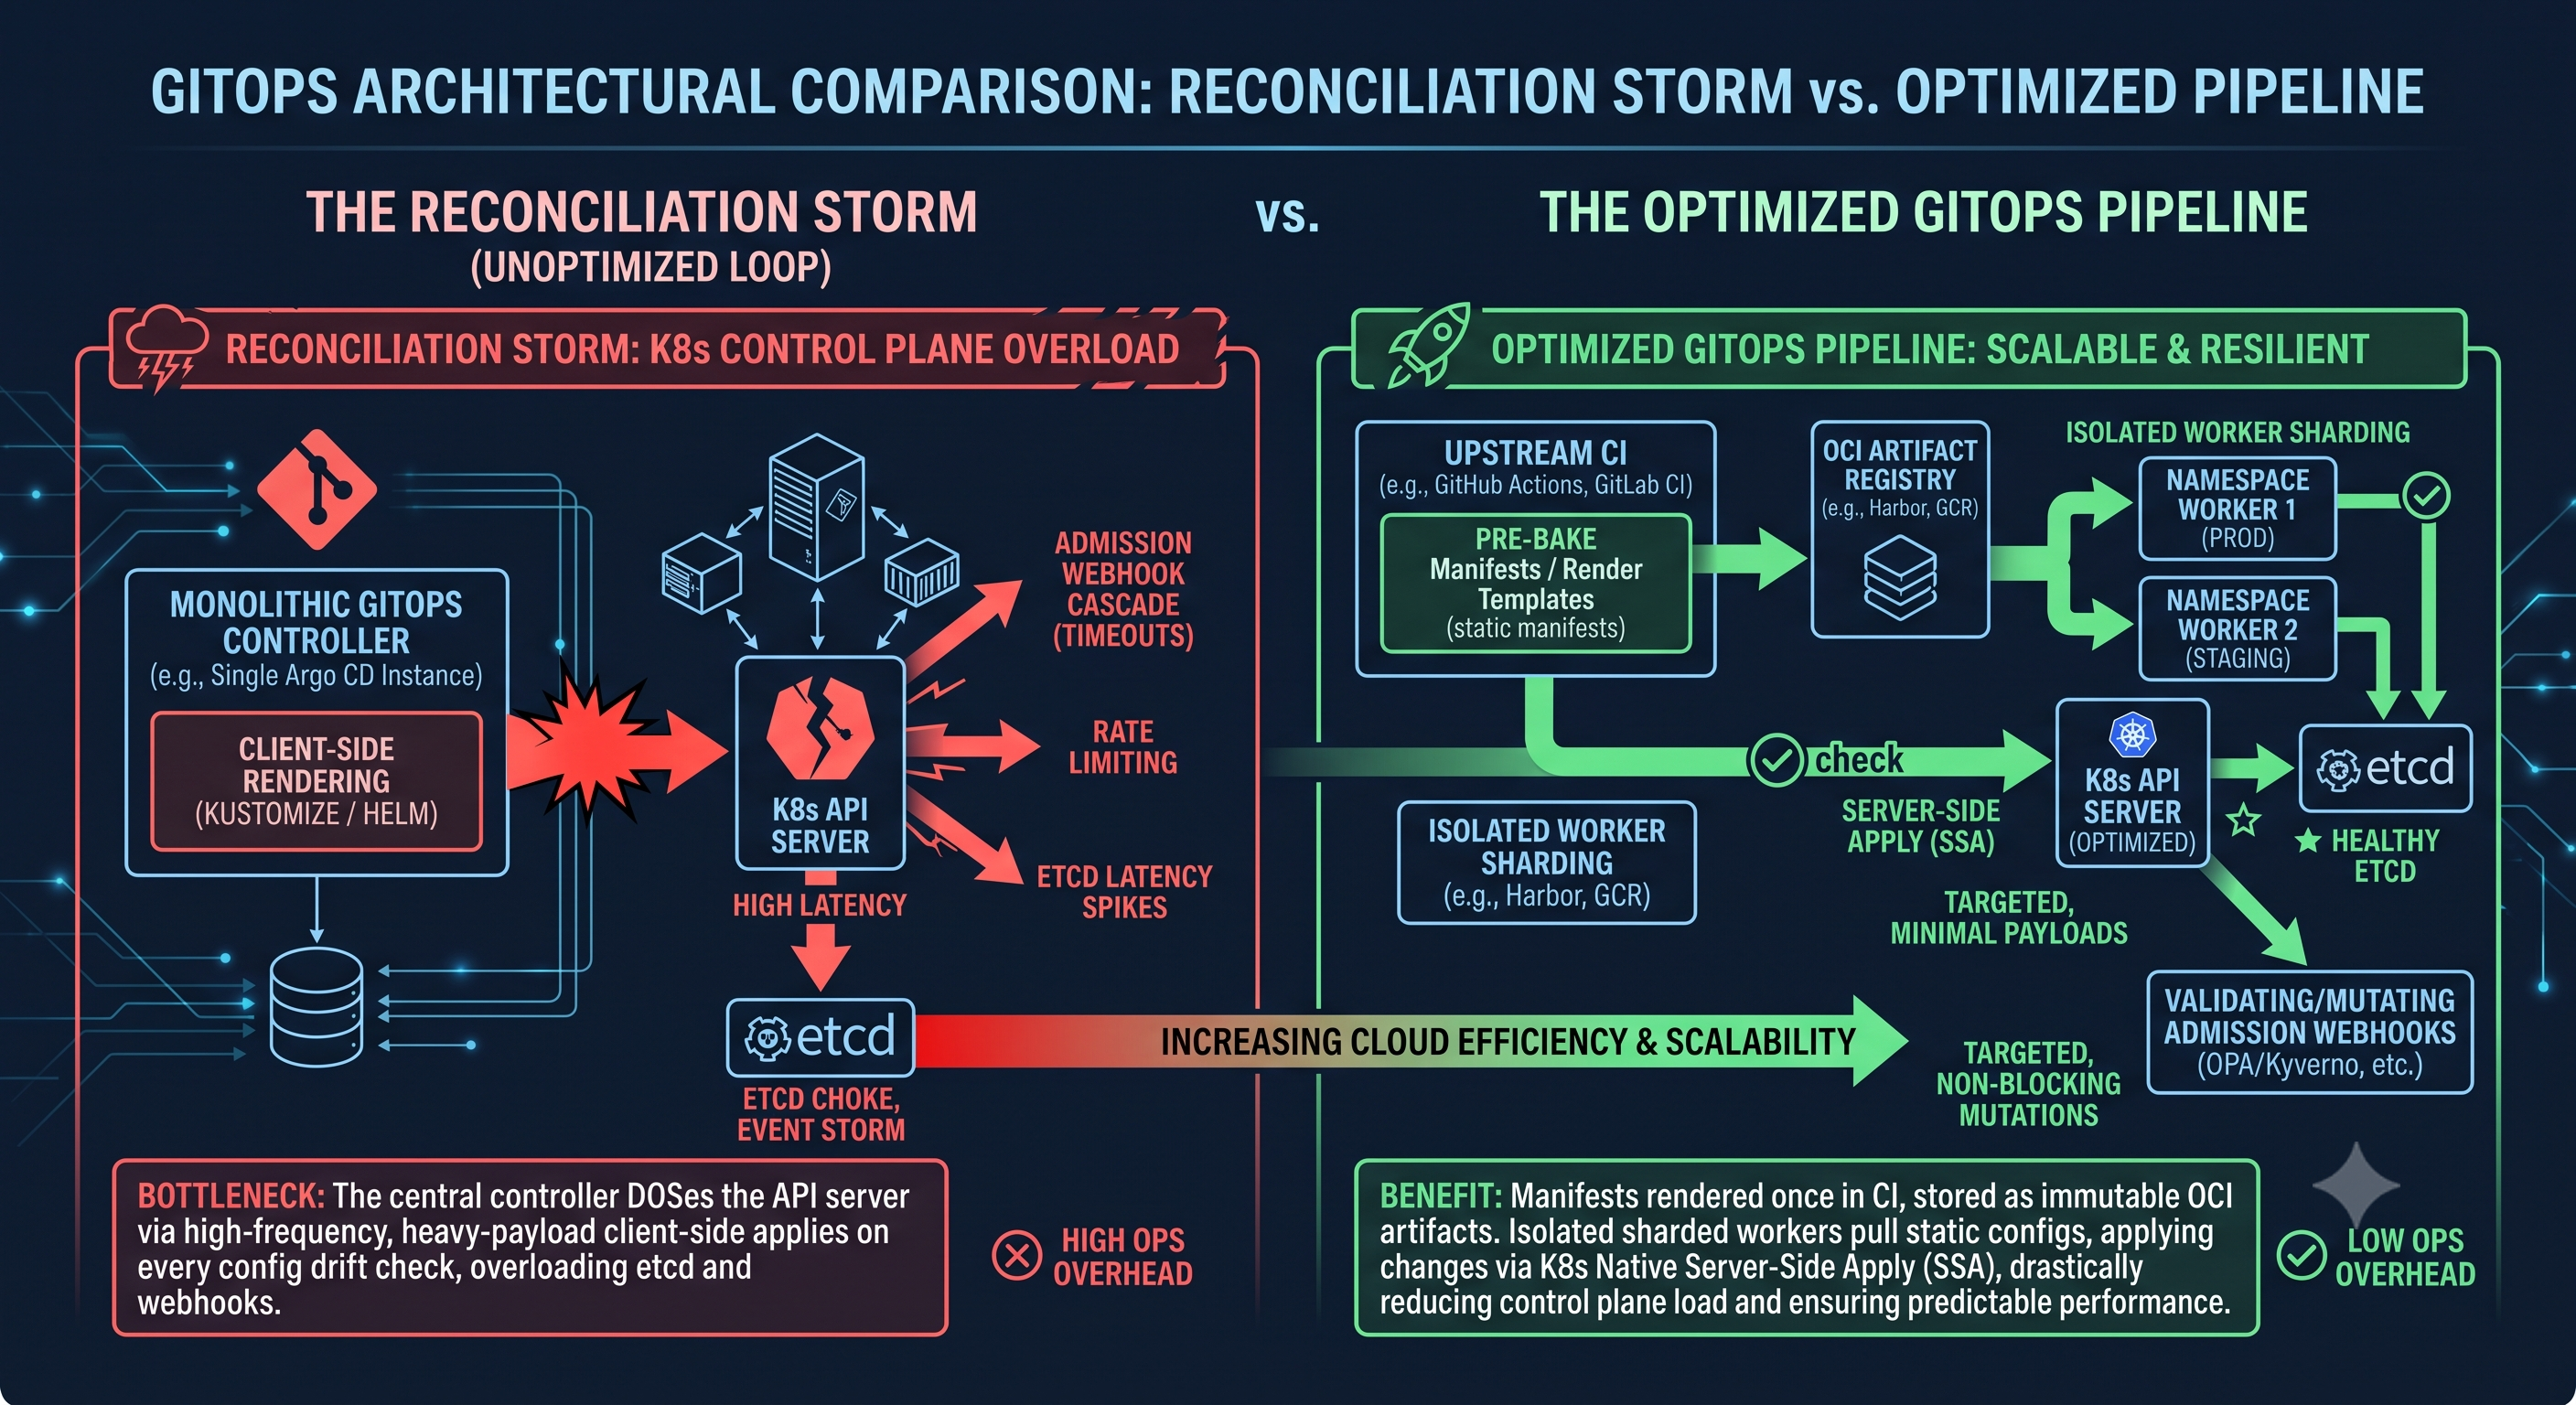 0 Comments 0 Shares 72 Views 0 Reviews
 -
The Over-Engineered Cluster: Why Kubernetes Isn't the Default for Every Workload
The cloud ecosystem often pushes teams toward complex orchestration long before they reach the scale that justifies it. Infrastructure should solve tangible operational bottlenecks, not serve as a resume-padding exercise.
Reliable, scalable cloud engineering hinges on matching architectural complexity to team capacity:
The Hidden Tax of Control Plane Maintenance: Kubernetes provides incredible declarative control, but it demands constant operational maintenance—ingress controllers, service meshes, cluster upgrades, sidecars, and stateful volume orchestration. If your team spends more time debugging YAML and control planes than deploying business logic, your tooling is working against you.
Boring Architecture Scales Farther Than You Think: Managed container platforms (like AWS ECS, Cloud Run, or Azure Container Apps) and simple PaaS environments handle auto-scaling, blue-green deployments, and health checks out of the box. Teams frequently reach millions of requests per day on simpler infrastructure before ever needing raw orchestration primitives.
Observability Before Orchestration: Splitting monoliths into microservices without mature tracing, centralized logging, and clear network boundaries turns standard debugging sessions into multi-day incident hunts. If you cannot trace a single transaction across services reliably, adding more distributed layers will only amplify downtime.
Scale the architecture to the problem, not to the industry hype.
Key Takeaways
Complexity Is a Cost: Every added orchestration layer increases cognitive overhead, maintenance hours, and potential failure modes.
Lean on Managed Primitives: Standard container-as-a-service offerings solve 90% of autoscaling and deployment needs without manual cluster overhead.
Earn Your Architecture: Introduce distributed systems and microservices only when traffic, domain boundaries, or organizational team size strictly demand it.
CTA
Let’s talk operational reality vs. architecture diagrams:
What was a time your team chose a simpler infrastructure stack and it ended up outperforming a complex setup?
Alternatively, what was the exact inflection point or incident that made migrating to full container orchestration genuinely necessary for your systems? Share your deployment experiences and architecture wins below.The Over-Engineered Cluster: Why Kubernetes Isn't the Default for Every Workload The cloud ecosystem often pushes teams toward complex orchestration long before they reach the scale that justifies it. Infrastructure should solve tangible operational bottlenecks, not serve as a resume-padding exercise. Reliable, scalable cloud engineering hinges on matching architectural complexity to team capacity: The Hidden Tax of Control Plane Maintenance: Kubernetes provides incredible declarative control, but it demands constant operational maintenance—ingress controllers, service meshes, cluster upgrades, sidecars, and stateful volume orchestration. If your team spends more time debugging YAML and control planes than deploying business logic, your tooling is working against you. Boring Architecture Scales Farther Than You Think: Managed container platforms (like AWS ECS, Cloud Run, or Azure Container Apps) and simple PaaS environments handle auto-scaling, blue-green deployments, and health checks out of the box. Teams frequently reach millions of requests per day on simpler infrastructure before ever needing raw orchestration primitives. Observability Before Orchestration: Splitting monoliths into microservices without mature tracing, centralized logging, and clear network boundaries turns standard debugging sessions into multi-day incident hunts. If you cannot trace a single transaction across services reliably, adding more distributed layers will only amplify downtime. Scale the architecture to the problem, not to the industry hype. Key Takeaways Complexity Is a Cost: Every added orchestration layer increases cognitive overhead, maintenance hours, and potential failure modes. Lean on Managed Primitives: Standard container-as-a-service offerings solve 90% of autoscaling and deployment needs without manual cluster overhead. Earn Your Architecture: Introduce distributed systems and microservices only when traffic, domain boundaries, or organizational team size strictly demand it. CTA Let’s talk operational reality vs. architecture diagrams: What was a time your team chose a simpler infrastructure stack and it ended up outperforming a complex setup? Alternatively, what was the exact inflection point or incident that made migrating to full container orchestration genuinely necessary for your systems? Share your deployment experiences and architecture wins below.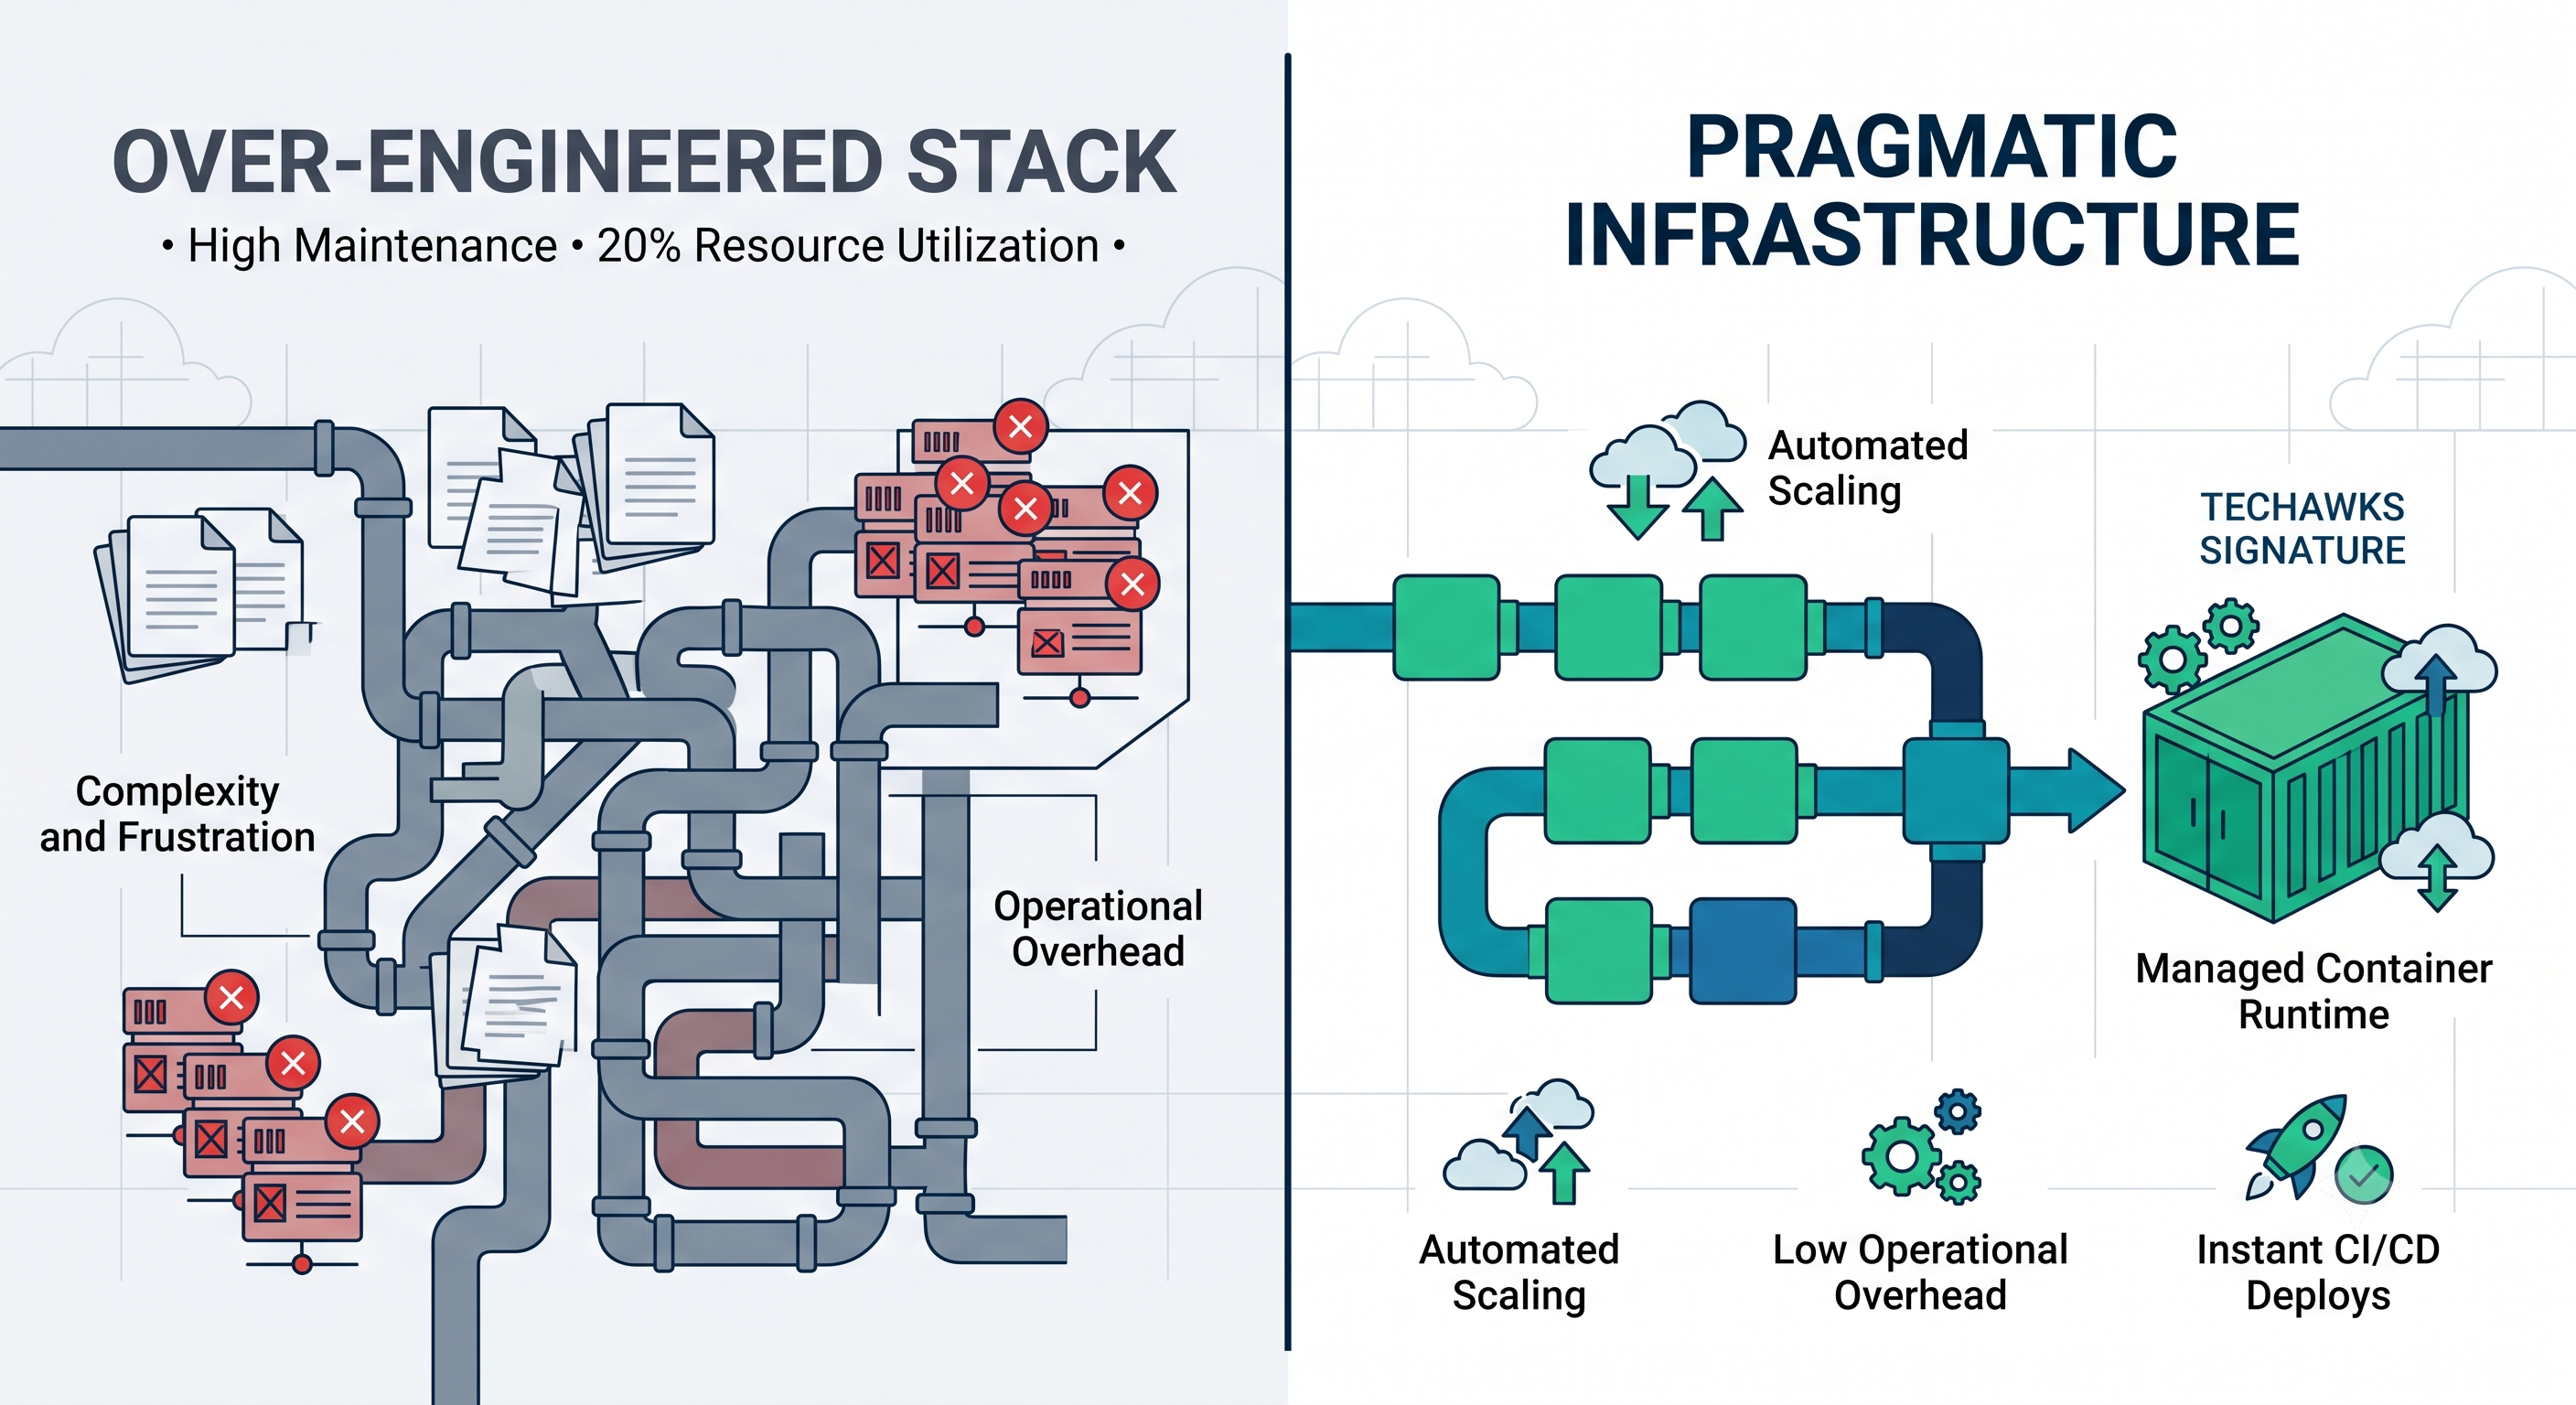 0 Comments 0 Shares 85 Views 0 Reviews
 -
The Fallacy of "Zero Downtime": Why Rolling Deployments Are Silently Dropping Your Data
Most DevOps teams celebrate when their orchestrator completes a rolling update with no reported service outages. However, container orchestrators only guarantee process replacement—not application-layer compatibility.
True zero-downtime deployments require handling the invisible overlap window when old and new code run simultaneously. Three operational friction points consistently undermine rolling updates:
Dual-version database contention: When a new version applies a schema migration (such as renaming or dropping a column), legacy pods still handle active traffic. If an old container queries a column that the migration just modified, requests hard-fail. Migrations must follow the expand-contract pattern: add new fields first, migrate read/write traffic across releases, and only remove legacy columns in a subsequent deployment.
Premature SIGTERM termination: When a container receives a termination signal, it must stop accepting new connections while completing in-flight transactions. Missing a preStop sleep hook or relying on unconfigured graceful shutdown routines causes load balancers to route live requests to pods that have already severed internal socket listeners.
Persistent connection drain latency: Modern microservices use persistent HTTP/2 or gRPC channels. Rolling out new pods does not automatically rebalance established client connections, causing stale instances to handle disproportionate traffic until they are forcefully killed, resulting in aborted RPCs.
Eliminating downtime isn't an infrastructure checkbox—it is a tight contract between your CI/CD pipeline, connection-draining policies, and forward/backward-compatible application code.
Key Takeaways
Rolling updates execute in parallel: Old and new code will coexist for minutes; your database schema must support both versions concurrently.
Decouple migrations from deployments: Always adopt the expand-and-contract pattern across separate release cycles.
Tune lifecycle hooks: Configure graceful shutdown handlers and upstream load balancer drain timeouts before shutting down runtime sockets.
Watch long-lived streams: Actively drain or cycle persistent HTTP/2 and gRPC connections to avoid abrupt client disconnects.
CTA
How does your team handle database schema migrations during rolling updates—do you strictly enforce expand-and-contract across multi-phase releases, or rely on canary environments and feature flags to isolate traffic? Drop your pipeline strategies below.The Fallacy of "Zero Downtime": Why Rolling Deployments Are Silently Dropping Your Data Most DevOps teams celebrate when their orchestrator completes a rolling update with no reported service outages. However, container orchestrators only guarantee process replacement—not application-layer compatibility. True zero-downtime deployments require handling the invisible overlap window when old and new code run simultaneously. Three operational friction points consistently undermine rolling updates: Dual-version database contention: When a new version applies a schema migration (such as renaming or dropping a column), legacy pods still handle active traffic. If an old container queries a column that the migration just modified, requests hard-fail. Migrations must follow the expand-contract pattern: add new fields first, migrate read/write traffic across releases, and only remove legacy columns in a subsequent deployment. Premature SIGTERM termination: When a container receives a termination signal, it must stop accepting new connections while completing in-flight transactions. Missing a preStop sleep hook or relying on unconfigured graceful shutdown routines causes load balancers to route live requests to pods that have already severed internal socket listeners. Persistent connection drain latency: Modern microservices use persistent HTTP/2 or gRPC channels. Rolling out new pods does not automatically rebalance established client connections, causing stale instances to handle disproportionate traffic until they are forcefully killed, resulting in aborted RPCs. Eliminating downtime isn't an infrastructure checkbox—it is a tight contract between your CI/CD pipeline, connection-draining policies, and forward/backward-compatible application code. Key Takeaways Rolling updates execute in parallel: Old and new code will coexist for minutes; your database schema must support both versions concurrently. Decouple migrations from deployments: Always adopt the expand-and-contract pattern across separate release cycles. Tune lifecycle hooks: Configure graceful shutdown handlers and upstream load balancer drain timeouts before shutting down runtime sockets. Watch long-lived streams: Actively drain or cycle persistent HTTP/2 and gRPC connections to avoid abrupt client disconnects. CTA How does your team handle database schema migrations during rolling updates—do you strictly enforce expand-and-contract across multi-phase releases, or rely on canary environments and feature flags to isolate traffic? Drop your pipeline strategies below.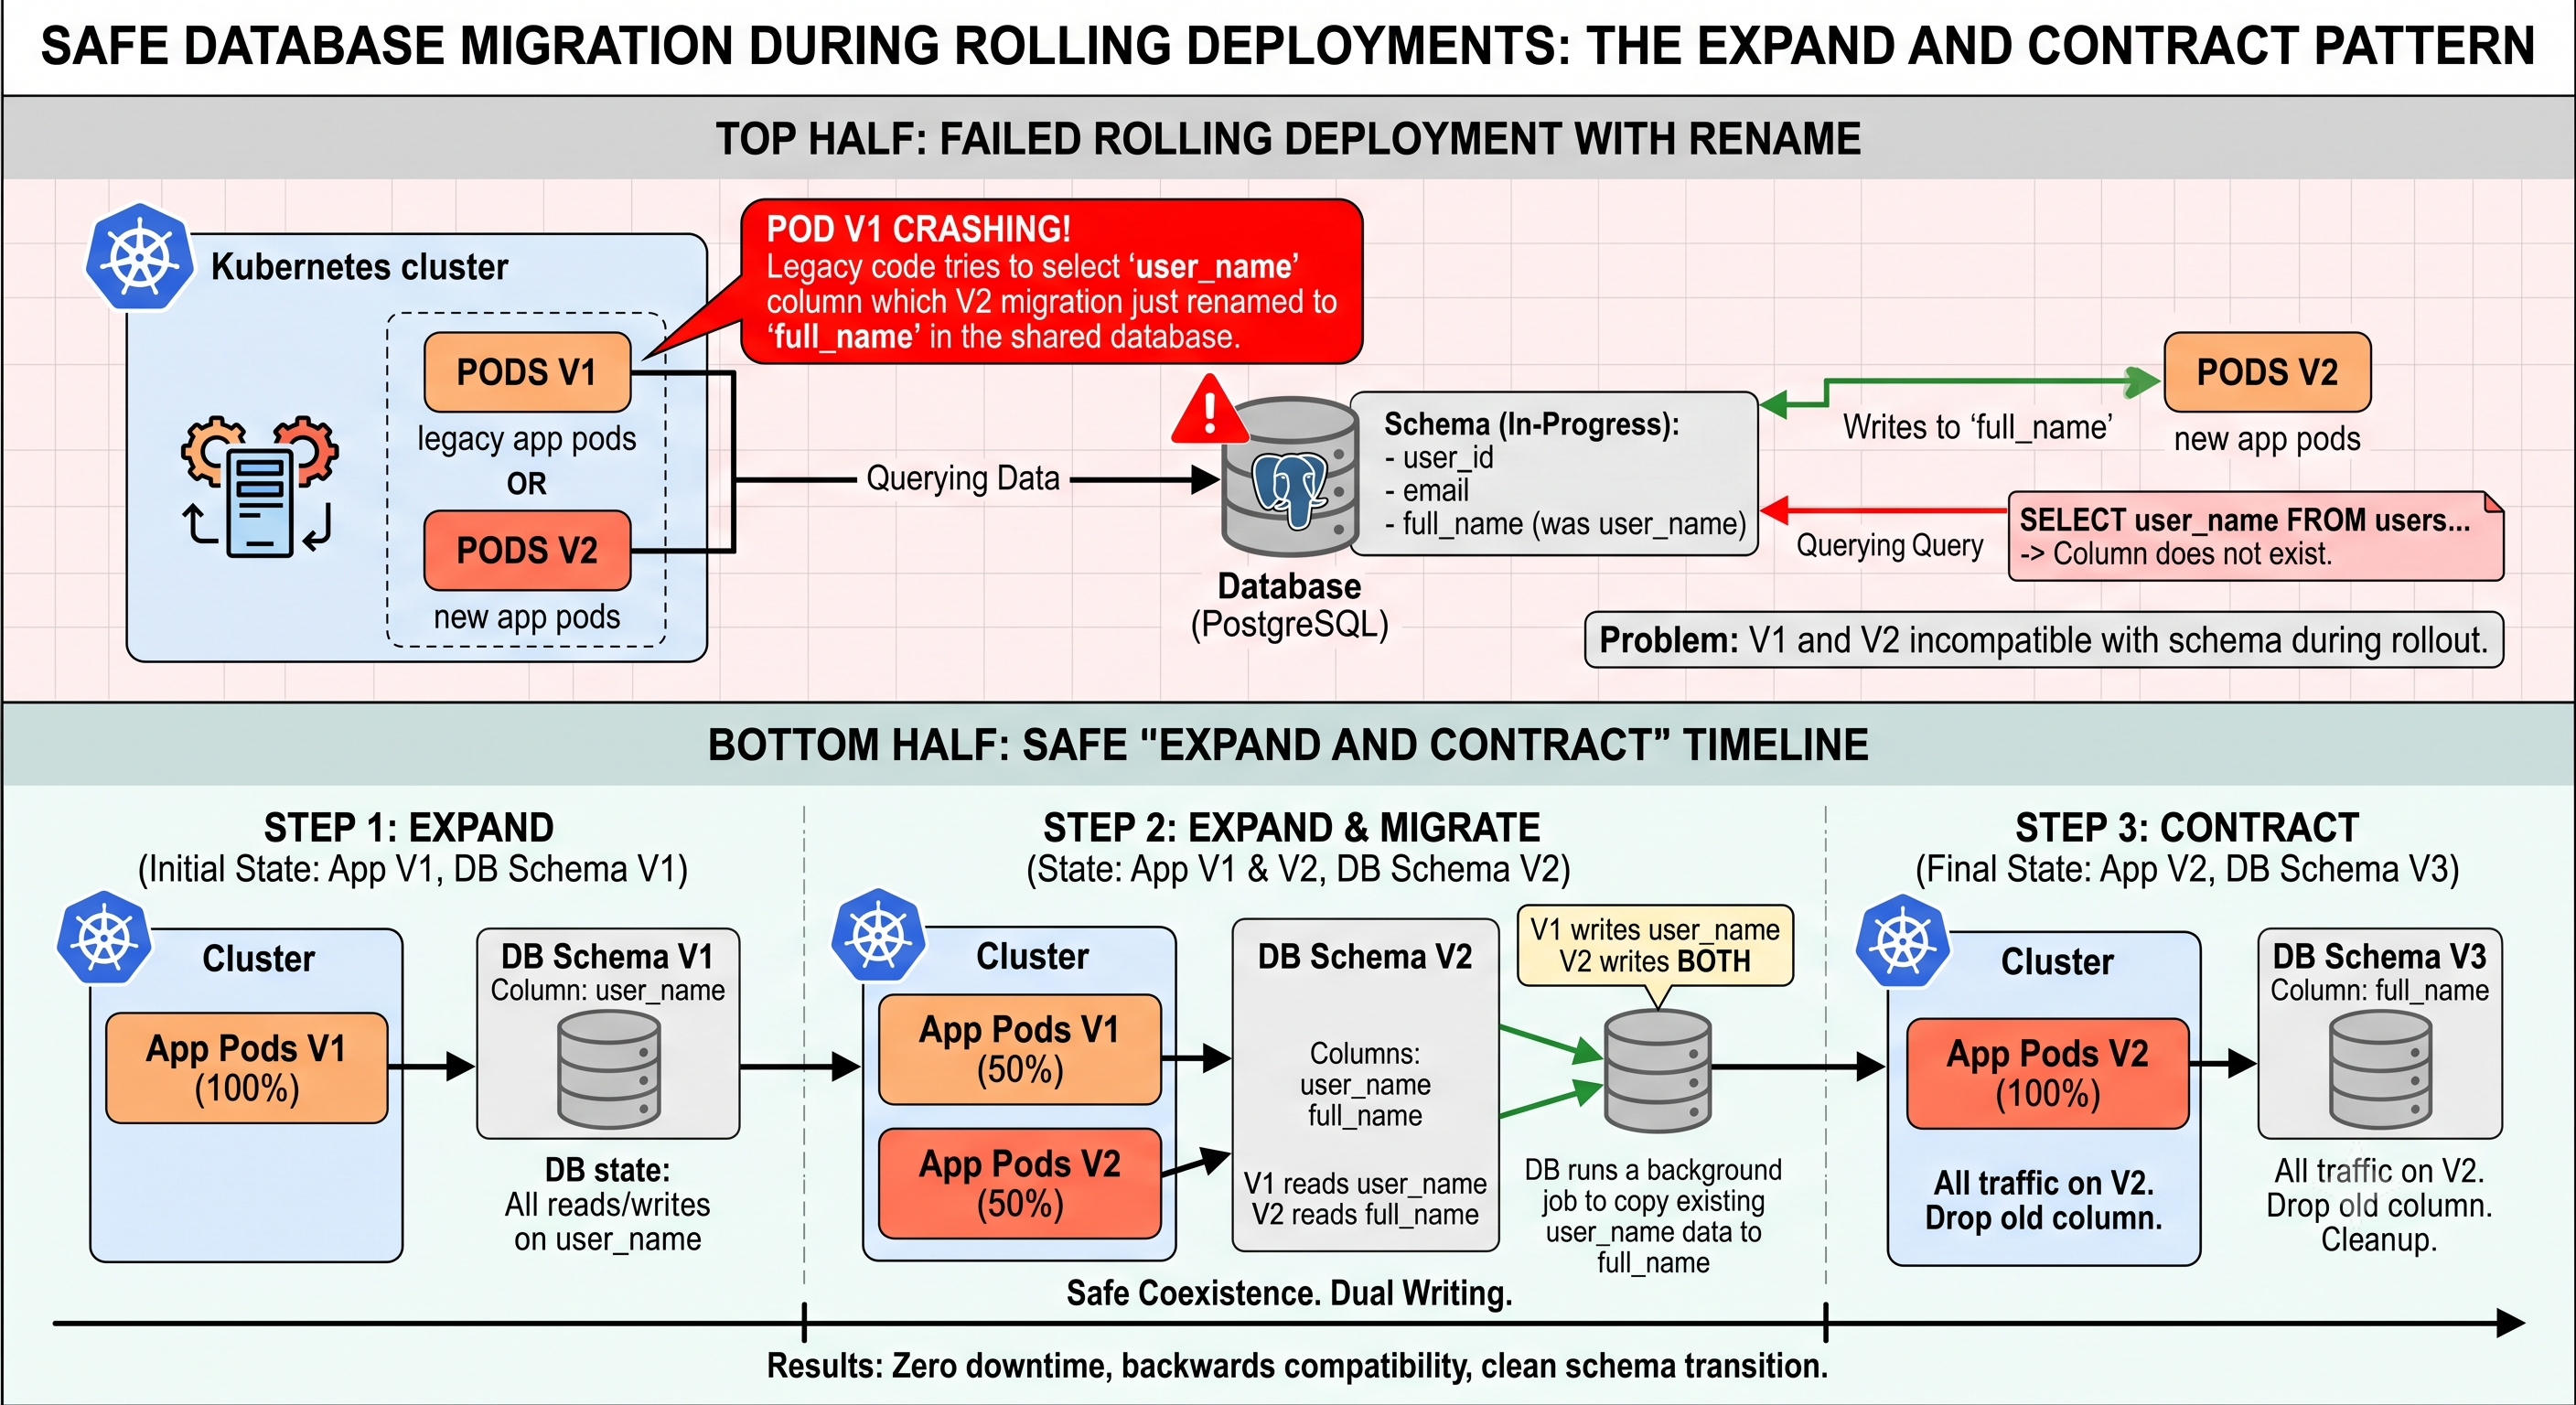 0 Comments 0 Shares 131 Views 0 Reviews
 -
The Platform Engineering Paradox: Why Your Internal Developer Platform (IDP) Is Leaking Kubernetes Complexity
The core promise of Platform Engineering was clear: reduce cognitive load and turn Kubernetes into invisible plumbing. Yet across the industry, IDP adoption frequently stalls at "Day 2." Teams build elaborate platform layers using tools like Crossplane, Backstage, or Argo CD, only for developers to bypass them because the abstractions either leak cluster complexity or become rigid bottlenecks.
The failure point rarely stems from the tooling; it’s an abstraction boundary problem.
When platform teams treat Kubernetes resources as the base unit exposed to application developers, developers are still forced to think in infrastructure primitives (Pods, ConfigMaps, Persistent Volume Claims) rather than application intent (Compute, Storage, Secret, Route).
Architectural Takeaway: Move from "Infrastructure Exposer" to "Intent-Based Golden Paths"
Decouple App Intent from Infrastructure Control Planes: Developers should declare what their application requires (e.g., type: web-service, database: postgres, traffic: public), not how Kubernetes orchestrates it. Use composite resource definitions (XRDs) or open standards like Open Application Model (OAM) to map intent to infrastructure under the hood.
Shift-Left Guardrails, Shift-Down Mechanics: Instead of forcing developers to configure security policies, Pod Disruption Budgets, or network policies in GitOps repos, bake these into the platform's control loop via admission controllers and mutation webhooks automatically.
Treat the Platform as a Product, Not a Mandate: Measure platform success by time-to-first-PR and self-service recovery rates, not cluster count. If an abstraction leaks raw kubectl debugging back onto product teams during a deployment failure, the abstraction has failed.
Discussion Question
Where do you draw the abstraction boundary in your organization? Do you allow application teams direct access to Kubernetes manifests and Helm values, or do they deploy strictly via high-level self-service APIs and service catalogs? What broke when you tried to enforce it?
CTA
Share your real-world deployment experiences in the comments below. Let’s compare notes on what works—from golden path setups to the messy edge cases of developer adoption.The Platform Engineering Paradox: Why Your Internal Developer Platform (IDP) Is Leaking Kubernetes Complexity The core promise of Platform Engineering was clear: reduce cognitive load and turn Kubernetes into invisible plumbing. Yet across the industry, IDP adoption frequently stalls at "Day 2." Teams build elaborate platform layers using tools like Crossplane, Backstage, or Argo CD, only for developers to bypass them because the abstractions either leak cluster complexity or become rigid bottlenecks. The failure point rarely stems from the tooling; it’s an abstraction boundary problem. When platform teams treat Kubernetes resources as the base unit exposed to application developers, developers are still forced to think in infrastructure primitives (Pods, ConfigMaps, Persistent Volume Claims) rather than application intent (Compute, Storage, Secret, Route). Architectural Takeaway: Move from "Infrastructure Exposer" to "Intent-Based Golden Paths" Decouple App Intent from Infrastructure Control Planes: Developers should declare what their application requires (e.g., type: web-service, database: postgres, traffic: public), not how Kubernetes orchestrates it. Use composite resource definitions (XRDs) or open standards like Open Application Model (OAM) to map intent to infrastructure under the hood. Shift-Left Guardrails, Shift-Down Mechanics: Instead of forcing developers to configure security policies, Pod Disruption Budgets, or network policies in GitOps repos, bake these into the platform's control loop via admission controllers and mutation webhooks automatically. Treat the Platform as a Product, Not a Mandate: Measure platform success by time-to-first-PR and self-service recovery rates, not cluster count. If an abstraction leaks raw kubectl debugging back onto product teams during a deployment failure, the abstraction has failed. Discussion Question Where do you draw the abstraction boundary in your organization? Do you allow application teams direct access to Kubernetes manifests and Helm values, or do they deploy strictly via high-level self-service APIs and service catalogs? What broke when you tried to enforce it? CTA Share your real-world deployment experiences in the comments below. Let’s compare notes on what works—from golden path setups to the messy edge cases of developer adoption.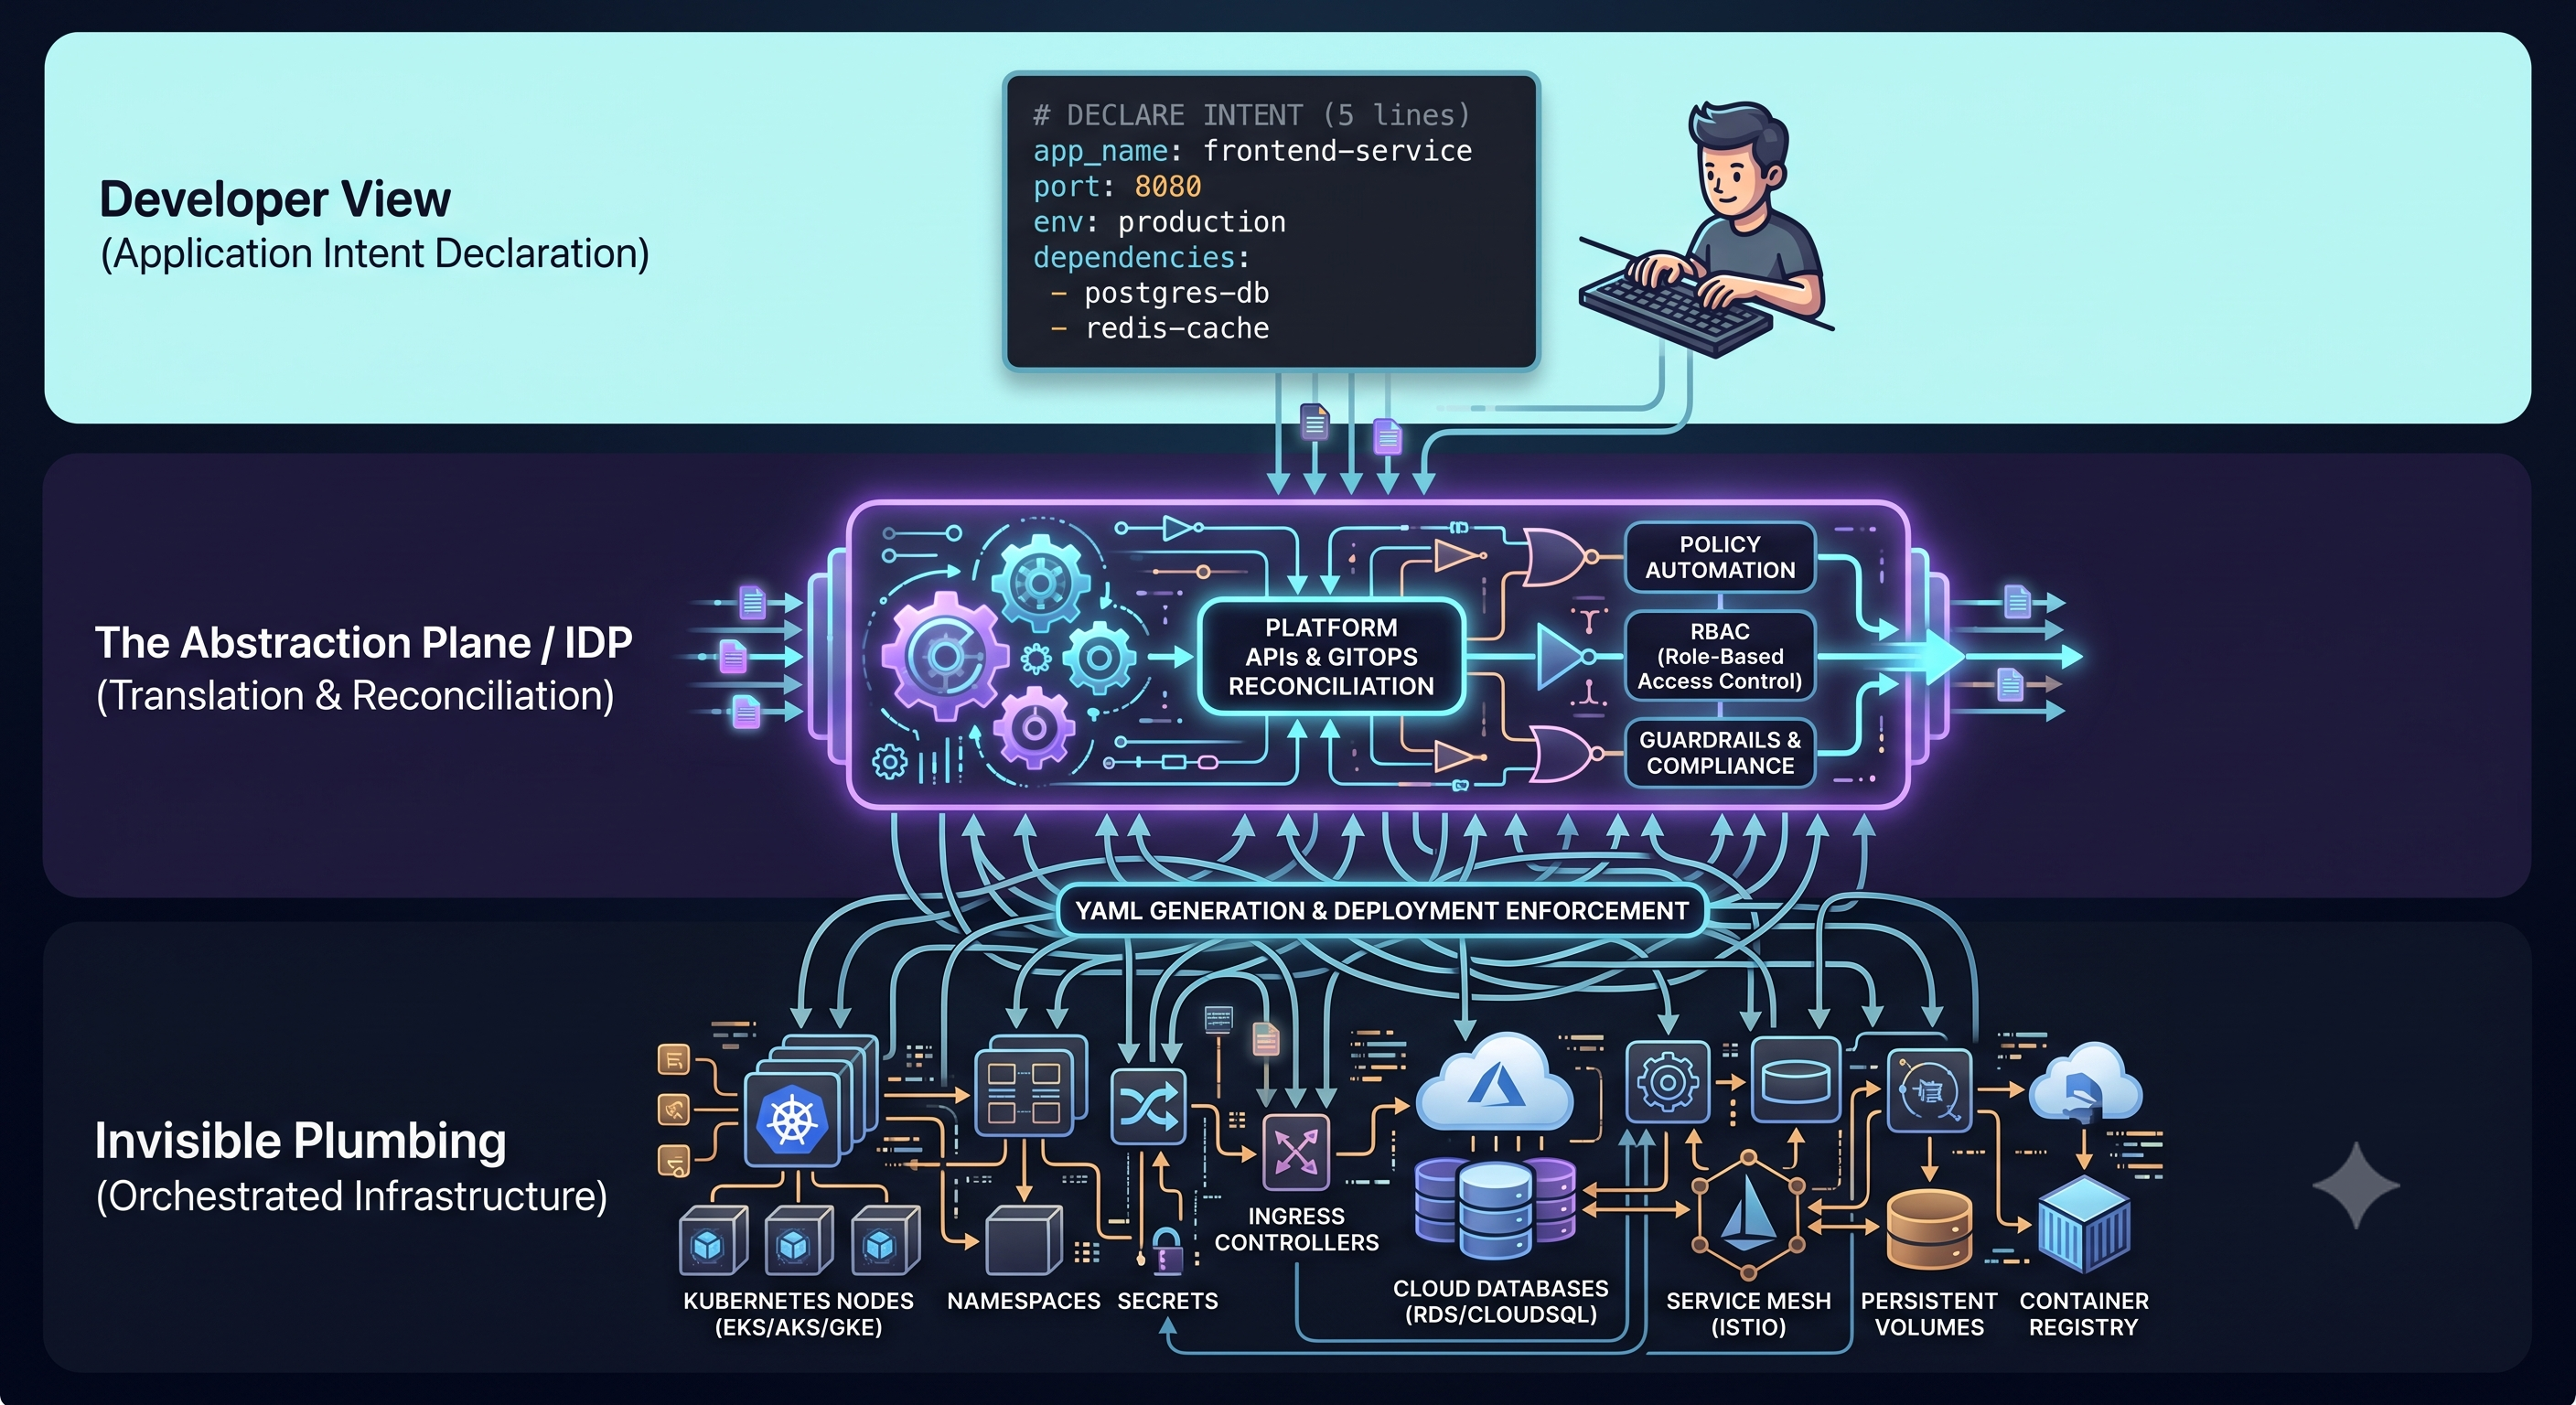 0 Comments 0 Shares 67 Views 0 Reviews
 -
The Infrastructure Dilemma: Managed Cloud Platforms or Self-Hosted Kubernetes?
Every DevOps and platform team grapples with the operational sweet spot between developer convenience and total infrastructure control. Managed PaaS and serverless offerings let teams ship fast without worrying about node orchestration, patch cycles, or control plane health. However, as workloads scale, egress costs, platform lock-in, and unpredictable pricing often push teams to reconsider.
On the other hand, self-managed Kubernetes or custom open-source stacks offer ultimate portability and granular resource control, but they demand dedicated platform engineering bandwidth to maintain reliability and security. Finding that balance dictates both your operational overhead and cloud spend.
Poll Question:
Where does your team deploy the majority of production workloads today?
Option 1: Fully Managed PaaS / Serverless (e.g., Cloud Run, App Runner, Lambda, ECS Fargate)
Option 2: Managed Kubernetes Clusters (e.g., EKS, GKE, AKS)
Option 3: Bare-metal / Self-hosted Open Source Stack (Custom K8s, Nomad, VMs)
Option 4: Hybrid Multi-Cloud Setup
Key Takeaways
Platform-as-a-Service maximizes early developer velocity, but cost scaling curves require proactive monitoring as traffic grows.
Kubernetes trades operational simplicity for architectural portability and predictable compute density at high scale.
The true cost of self-hosting is rarely compute—it is the engineering salary hours spent maintaining the control plane and toolchain.
CTA
Have you ever migrated workloads from a managed PaaS to Kubernetes—or repatriated back to simpler services? Share your deployment war stories, unexpected cost surprises, or cluster setup lessons in the comments below!The Infrastructure Dilemma: Managed Cloud Platforms or Self-Hosted Kubernetes? Every DevOps and platform team grapples with the operational sweet spot between developer convenience and total infrastructure control. Managed PaaS and serverless offerings let teams ship fast without worrying about node orchestration, patch cycles, or control plane health. However, as workloads scale, egress costs, platform lock-in, and unpredictable pricing often push teams to reconsider. On the other hand, self-managed Kubernetes or custom open-source stacks offer ultimate portability and granular resource control, but they demand dedicated platform engineering bandwidth to maintain reliability and security. Finding that balance dictates both your operational overhead and cloud spend. Poll Question: Where does your team deploy the majority of production workloads today? Option 1: Fully Managed PaaS / Serverless (e.g., Cloud Run, App Runner, Lambda, ECS Fargate) Option 2: Managed Kubernetes Clusters (e.g., EKS, GKE, AKS) Option 3: Bare-metal / Self-hosted Open Source Stack (Custom K8s, Nomad, VMs) Option 4: Hybrid Multi-Cloud Setup Key Takeaways Platform-as-a-Service maximizes early developer velocity, but cost scaling curves require proactive monitoring as traffic grows. Kubernetes trades operational simplicity for architectural portability and predictable compute density at high scale. The true cost of self-hosting is rarely compute—it is the engineering salary hours spent maintaining the control plane and toolchain. CTA Have you ever migrated workloads from a managed PaaS to Kubernetes—or repatriated back to simpler services? Share your deployment war stories, unexpected cost surprises, or cluster setup lessons in the comments below!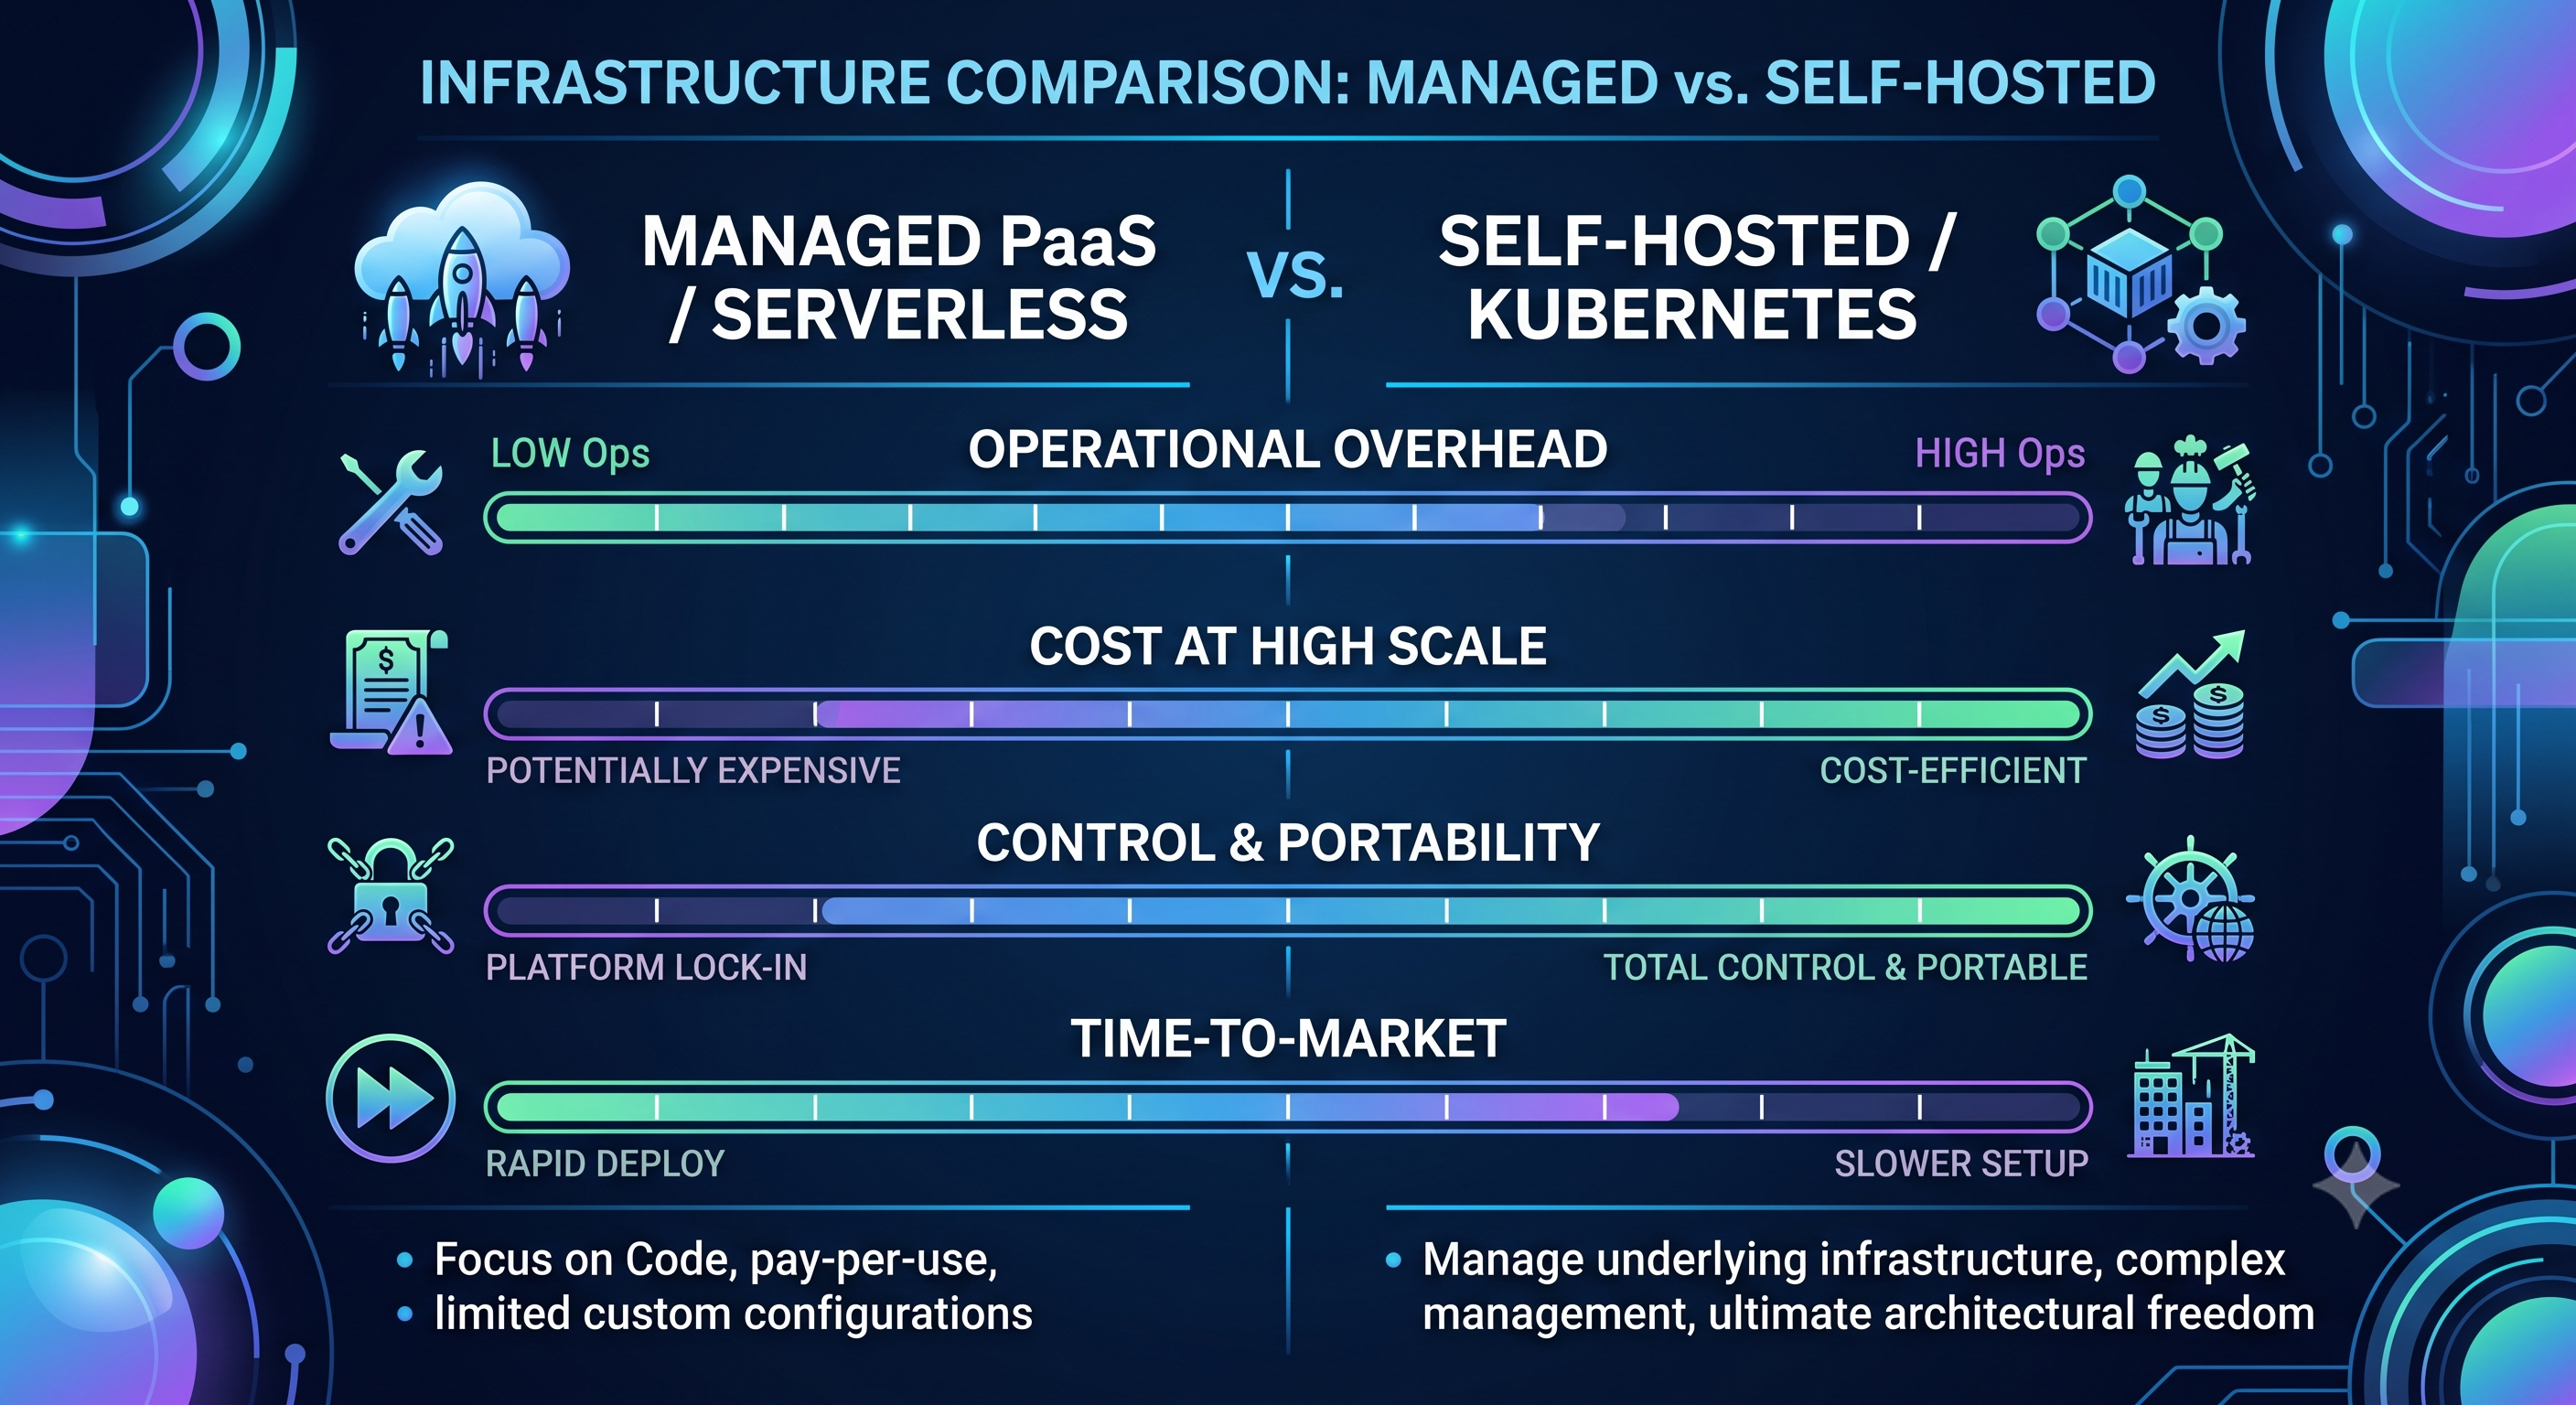 0 Comments 0 Shares 94 Views 0 Reviews
More Stories