


Techawks Startups is the startup and innovation community of Techawks, bringing together founders, entrepreneurs, developers, AI innovators, investors, mentors, and startup enthusiasts to build the next generation of technology companies.
Explore startup ideas, MVP development, fundraising, product launches, AI-powered innovation, growth marketing, scaling strategies, networking opportunities, and founder experiences. Share knowledge, collaborate on projects, discover emerging trends, and grow alongside a global community of innovators.
Explore startup ideas, MVP development, fundraising, product launches, AI-powered innovation, growth marketing, scaling strategies, networking opportunities, and founder experiences. Share knowledge, collaborate on projects, discover emerging trends, and grow alongside a global community of innovators.
-
PBID: 0230001500000006
-
1 A la gente le gusta esto.
-
60 Entradas
-
60 Fotos
-
0 Videos
-
Vista previa
-
Science and Technology
Buscar

 English
 Arabic
 French
 Portuguese
 Deutsch
 Turkish
 Dutch
Dutch
 Italiano
 Russian
 Romaian
 Portuguese (Brazil)
 Greek
Greek
Actualizaciones Recientes
-
Moving Beyond the Pilot Phase: Why Orchestration is the Ultimate Bottleneck for Agentic Startups
The defining technical challenge for AI startups isn't finding a clever prompt—it’s agent orchestration. As the ecosystem matures, the race has shifted from building standalone models to engineering reliable multi-agent workflows where specialized systems coordinate, pass context, and handle complex business logic autonomously.
Why it matters:
Without disciplined orchestration and rigorous state governance, multi-agent systems suffer from error propagation—where a minor miscalculation in step one cascades into catastrophic failures by step three. Investors and enterprise buyers no longer care about flashy sandbox demos; they demand predictable ROI, determinism, and robust fallback mechanisms.
What you can learn (The Technical Framework):
When architecting autonomous workflows for your startup, focus on three foundational design pillars:
Deterministic State Graphs: Never rely on linear pipelines for complex tasks. Use graph-based frameworks to model loops, allowing agents to self-correct and re-try steps (e.g., verifying generated code against unit tests).
Built-In Human Checkpoints: Design friction deliberately into your workflows. Strategic human-in-the-loop approval gates act as critical quality-control buffers for high-stakes business decisions.
Context Grounding & Memory Boundaries: Isolate short-term execution memory from long-term institutional knowledge bases to prevent hallucination drift and keep token overhead optimized.
Discussion Question
Are you building your current startup product with multi-agent orchestration frameworks, or are you still relying on traditional linear pipelines? What is your biggest roadblock to production reliability?
CTA (Join Startup Founders & Entrepreneurs)
Ready to build resilient, scalable AI products and scale your venture alongside top-tier technical founders? Join the Techawks Startup Founders & Entrepreneurs community today and accelerate your roadmap:Moving Beyond the Pilot Phase: Why Orchestration is the Ultimate Bottleneck for Agentic Startups The defining technical challenge for AI startups isn't finding a clever prompt—it’s agent orchestration. As the ecosystem matures, the race has shifted from building standalone models to engineering reliable multi-agent workflows where specialized systems coordinate, pass context, and handle complex business logic autonomously. Why it matters: Without disciplined orchestration and rigorous state governance, multi-agent systems suffer from error propagation—where a minor miscalculation in step one cascades into catastrophic failures by step three. Investors and enterprise buyers no longer care about flashy sandbox demos; they demand predictable ROI, determinism, and robust fallback mechanisms. What you can learn (The Technical Framework): When architecting autonomous workflows for your startup, focus on three foundational design pillars: Deterministic State Graphs: Never rely on linear pipelines for complex tasks. Use graph-based frameworks to model loops, allowing agents to self-correct and re-try steps (e.g., verifying generated code against unit tests). Built-In Human Checkpoints: Design friction deliberately into your workflows. Strategic human-in-the-loop approval gates act as critical quality-control buffers for high-stakes business decisions. Context Grounding & Memory Boundaries: Isolate short-term execution memory from long-term institutional knowledge bases to prevent hallucination drift and keep token overhead optimized. Discussion Question Are you building your current startup product with multi-agent orchestration frameworks, or are you still relying on traditional linear pipelines? What is your biggest roadblock to production reliability? CTA (Join Startup Founders & Entrepreneurs) Ready to build resilient, scalable AI products and scale your venture alongside top-tier technical founders? Join the Techawks Startup Founders & Entrepreneurs community today and accelerate your roadmap: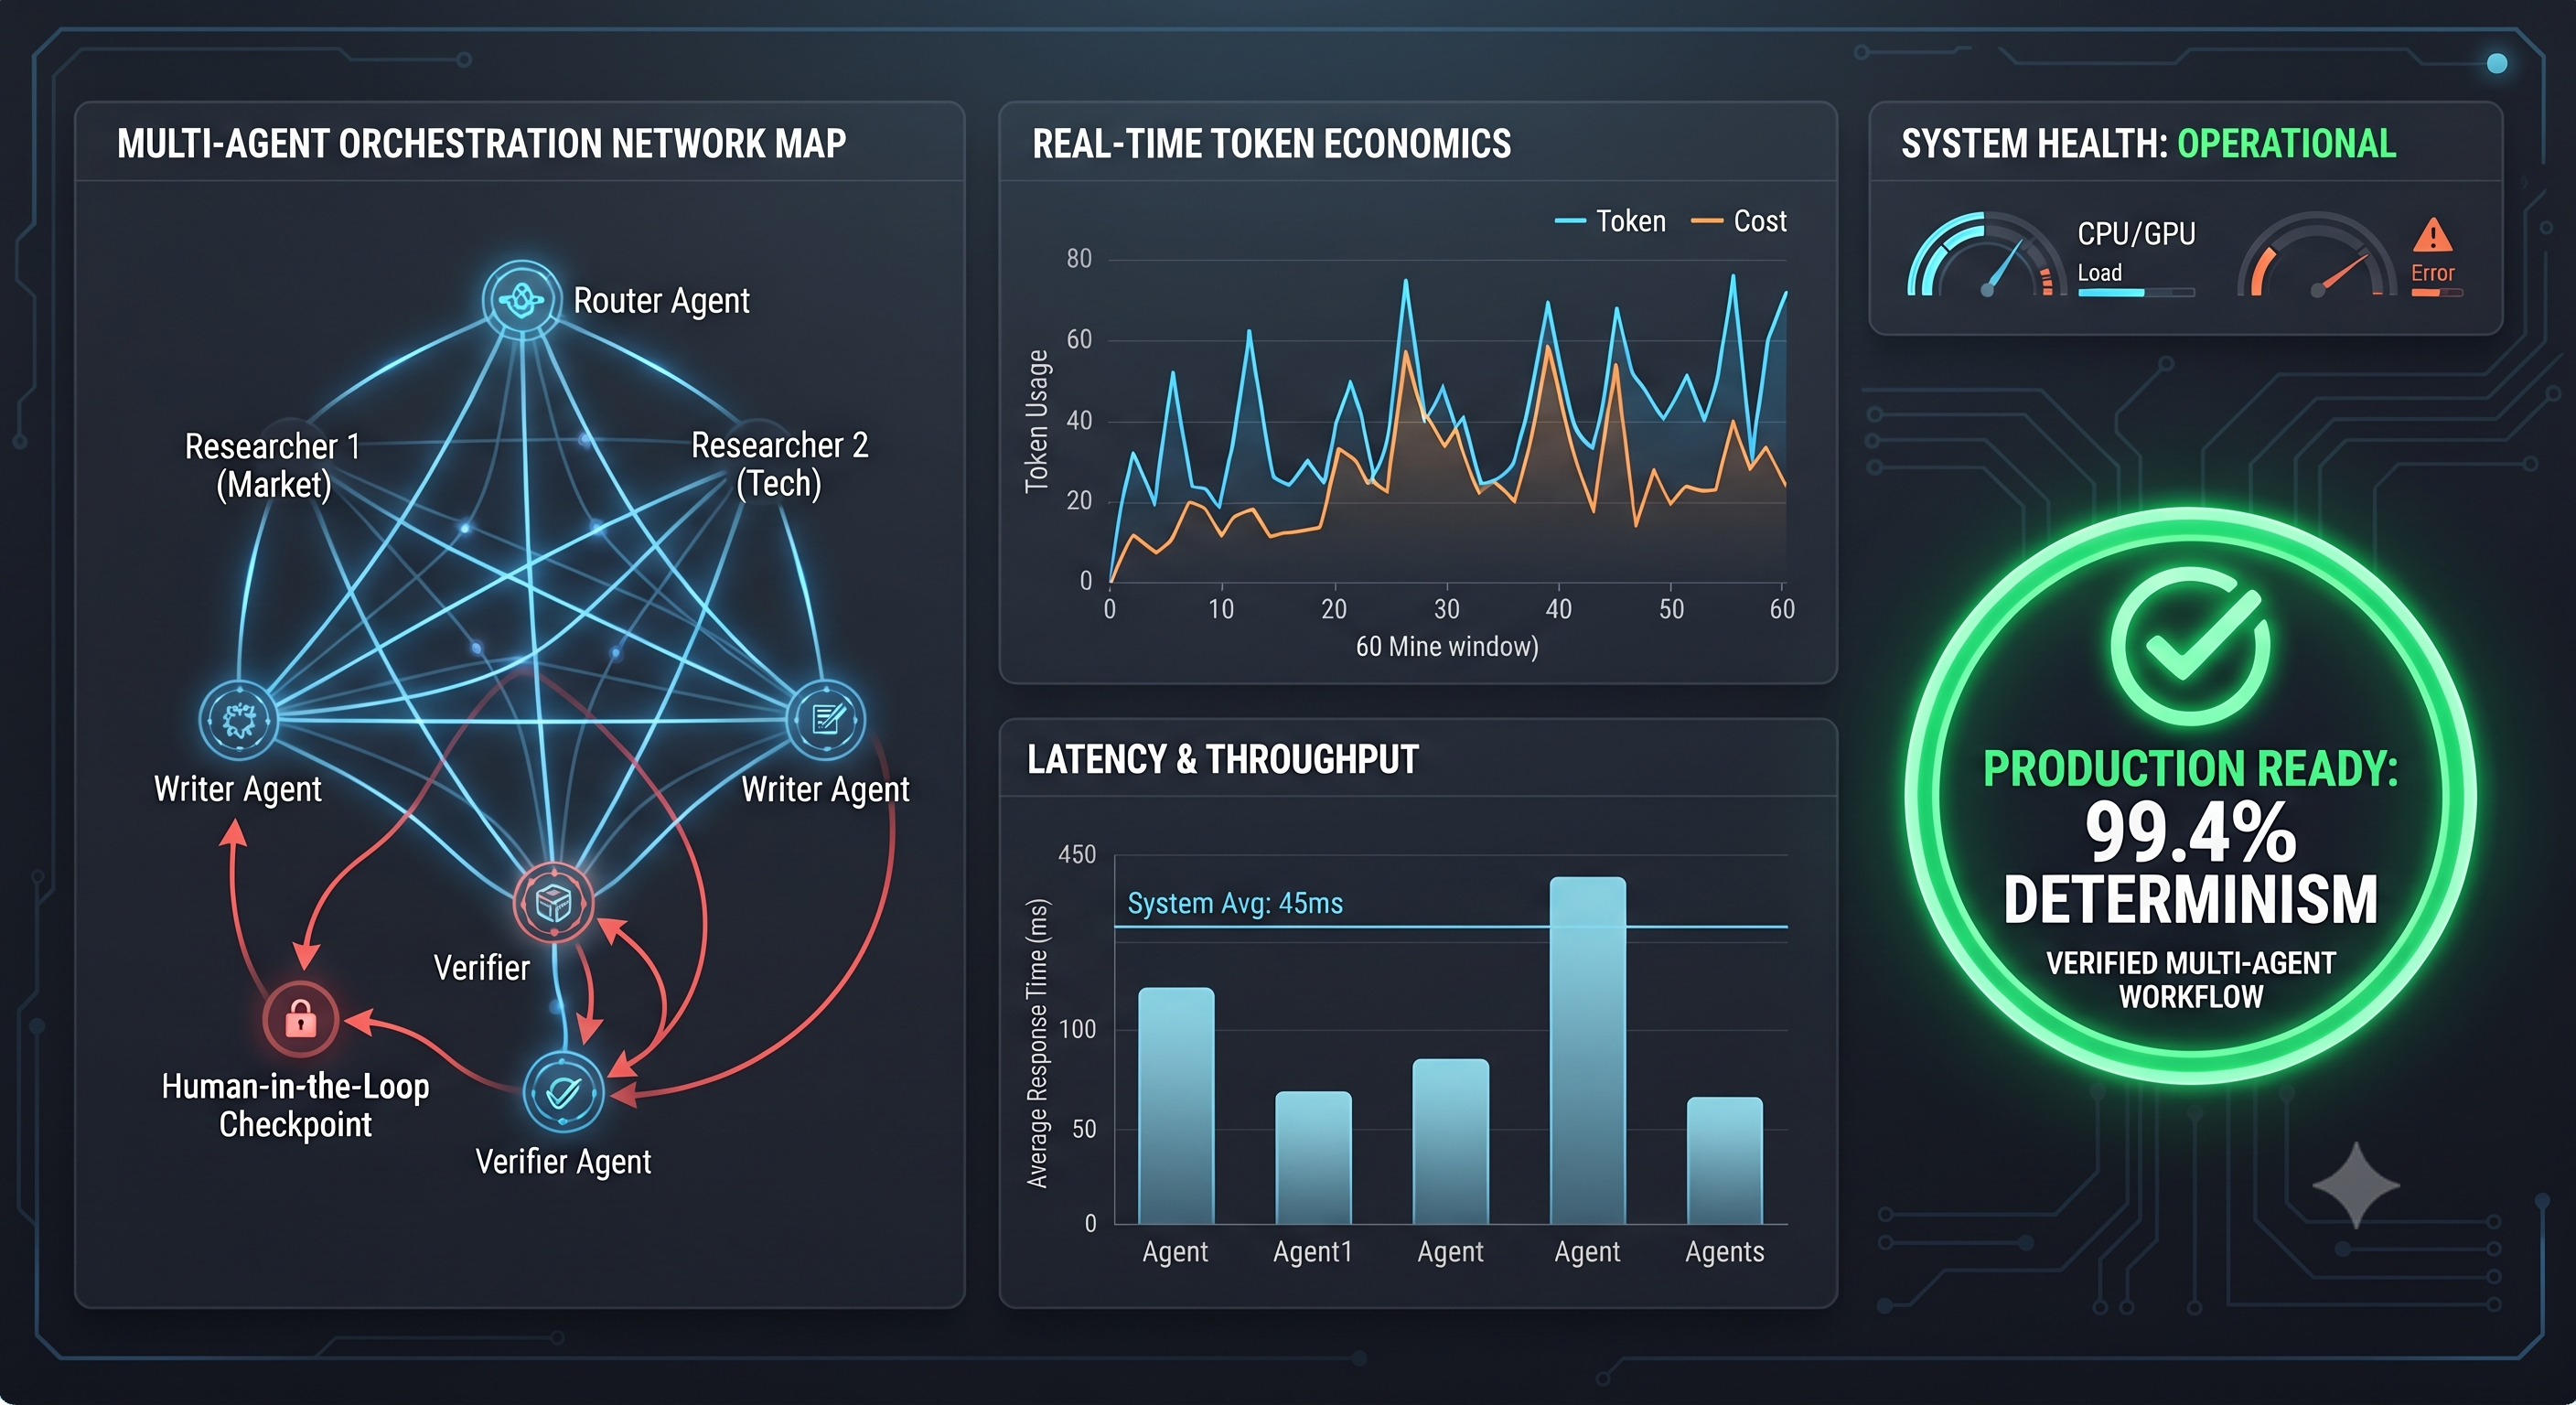 0 Commentarios 0 Acciones 180 Views 0 Vista previa
 -
The Flat-Rate Trap: Why Classic SaaS Pricing Is Silently Bankrupting AI Startups
Founders raised on the playbook of the 2010s are running into a structural wall:
❌ The Myth: "Charge a flat $30 to $50 per-seat monthly subscription. Software has near-zero marginal cost, so more daily active users automatically equals higher margins and enterprise valuation."
✅ The Reality: In traditional SaaS, the marginal cost of serving user number 10,000 was effectively zero. In AI-native applications, growth without metered unit economics scales cost faster than revenue. Power users don't boost your bottom line—they erode your gross margins.
The Anatomy of the Margin Collapse:
The Variable Cost-of-Goods-Sold (COGS) Reality: In conventional B2B software, hosting and infrastructure make up roughly 10% to 15% of revenue, leaving gross margins of 80% to 85%. In AI-native products, inference compute, token egress, embedding lookups, and multi-agent loops sit directly inside COGS.
The Power-User Inversion: On a flat-rate tier, casual users subsidize power users. But as your core audience matures, a customer running complex multi-step agent workflows can easily cost $60/month in API/GPU compute against a $30/month subscription—turning your most engaged champions into your largest financial liabilities.
The Valuation Penalty: Late-seed and Series A investors evaluate gross margins above all else. Startups posting 40% gross margins get valued like low-margin IT services rather than high-multiple software companies.
How High-Defensibility Founders Price Today:
Decouple Platform Access from Execution Units: Move to a hybrid model. Charge a predictable base subscription for UI, workflow integrations, and seat permissions, paired with credit-based or metered billing for high-compute model invocations.
Price by Outcome, Not Just Per-Seat: Instead of billing per user seat, align pricing with delivered business units (e.g., contracts audited, tickets resolved, database schemas migrated). This anchors price to real ROI rather than raw token usage.
Implement Tiered Inference Routing: Don't route simple queries to high-cost reasoning models. Dynamically downgrade casual extraction and classification to small open-weight models, preserving expensive inference budgets only for complex reasoning tasks.
The takeaway: Building a defensible startup isn't just about owning proprietary data—it's about surviving your own product engagement. If your unit economics can't survive a power user, your business model is a liability disguised as traction.
Discussion Question
What does your gross margin look like after factoring in model inference and GPU compute? Have you shifted to hybrid or credit-based pricing, or are you still relying on flat per-seat subscriptions?
CTA (Join Startup Founders & Entrepreneurs)
Join the Startup Founders & Entrepreneurs community to benchmark unit economics, dissect real AI pricing strategies, and build defensible, capital-efficient businesses.The Flat-Rate Trap: Why Classic SaaS Pricing Is Silently Bankrupting AI Startups Founders raised on the playbook of the 2010s are running into a structural wall: ❌ The Myth: "Charge a flat $30 to $50 per-seat monthly subscription. Software has near-zero marginal cost, so more daily active users automatically equals higher margins and enterprise valuation." ✅ The Reality: In traditional SaaS, the marginal cost of serving user number 10,000 was effectively zero. In AI-native applications, growth without metered unit economics scales cost faster than revenue. Power users don't boost your bottom line—they erode your gross margins. The Anatomy of the Margin Collapse: The Variable Cost-of-Goods-Sold (COGS) Reality: In conventional B2B software, hosting and infrastructure make up roughly 10% to 15% of revenue, leaving gross margins of 80% to 85%. In AI-native products, inference compute, token egress, embedding lookups, and multi-agent loops sit directly inside COGS. The Power-User Inversion: On a flat-rate tier, casual users subsidize power users. But as your core audience matures, a customer running complex multi-step agent workflows can easily cost $60/month in API/GPU compute against a $30/month subscription—turning your most engaged champions into your largest financial liabilities. The Valuation Penalty: Late-seed and Series A investors evaluate gross margins above all else. Startups posting 40% gross margins get valued like low-margin IT services rather than high-multiple software companies. How High-Defensibility Founders Price Today: Decouple Platform Access from Execution Units: Move to a hybrid model. Charge a predictable base subscription for UI, workflow integrations, and seat permissions, paired with credit-based or metered billing for high-compute model invocations. Price by Outcome, Not Just Per-Seat: Instead of billing per user seat, align pricing with delivered business units (e.g., contracts audited, tickets resolved, database schemas migrated). This anchors price to real ROI rather than raw token usage. Implement Tiered Inference Routing: Don't route simple queries to high-cost reasoning models. Dynamically downgrade casual extraction and classification to small open-weight models, preserving expensive inference budgets only for complex reasoning tasks. The takeaway: Building a defensible startup isn't just about owning proprietary data—it's about surviving your own product engagement. If your unit economics can't survive a power user, your business model is a liability disguised as traction. Discussion Question What does your gross margin look like after factoring in model inference and GPU compute? Have you shifted to hybrid or credit-based pricing, or are you still relying on flat per-seat subscriptions? CTA (Join Startup Founders & Entrepreneurs) Join the Startup Founders & Entrepreneurs community to benchmark unit economics, dissect real AI pricing strategies, and build defensible, capital-efficient businesses.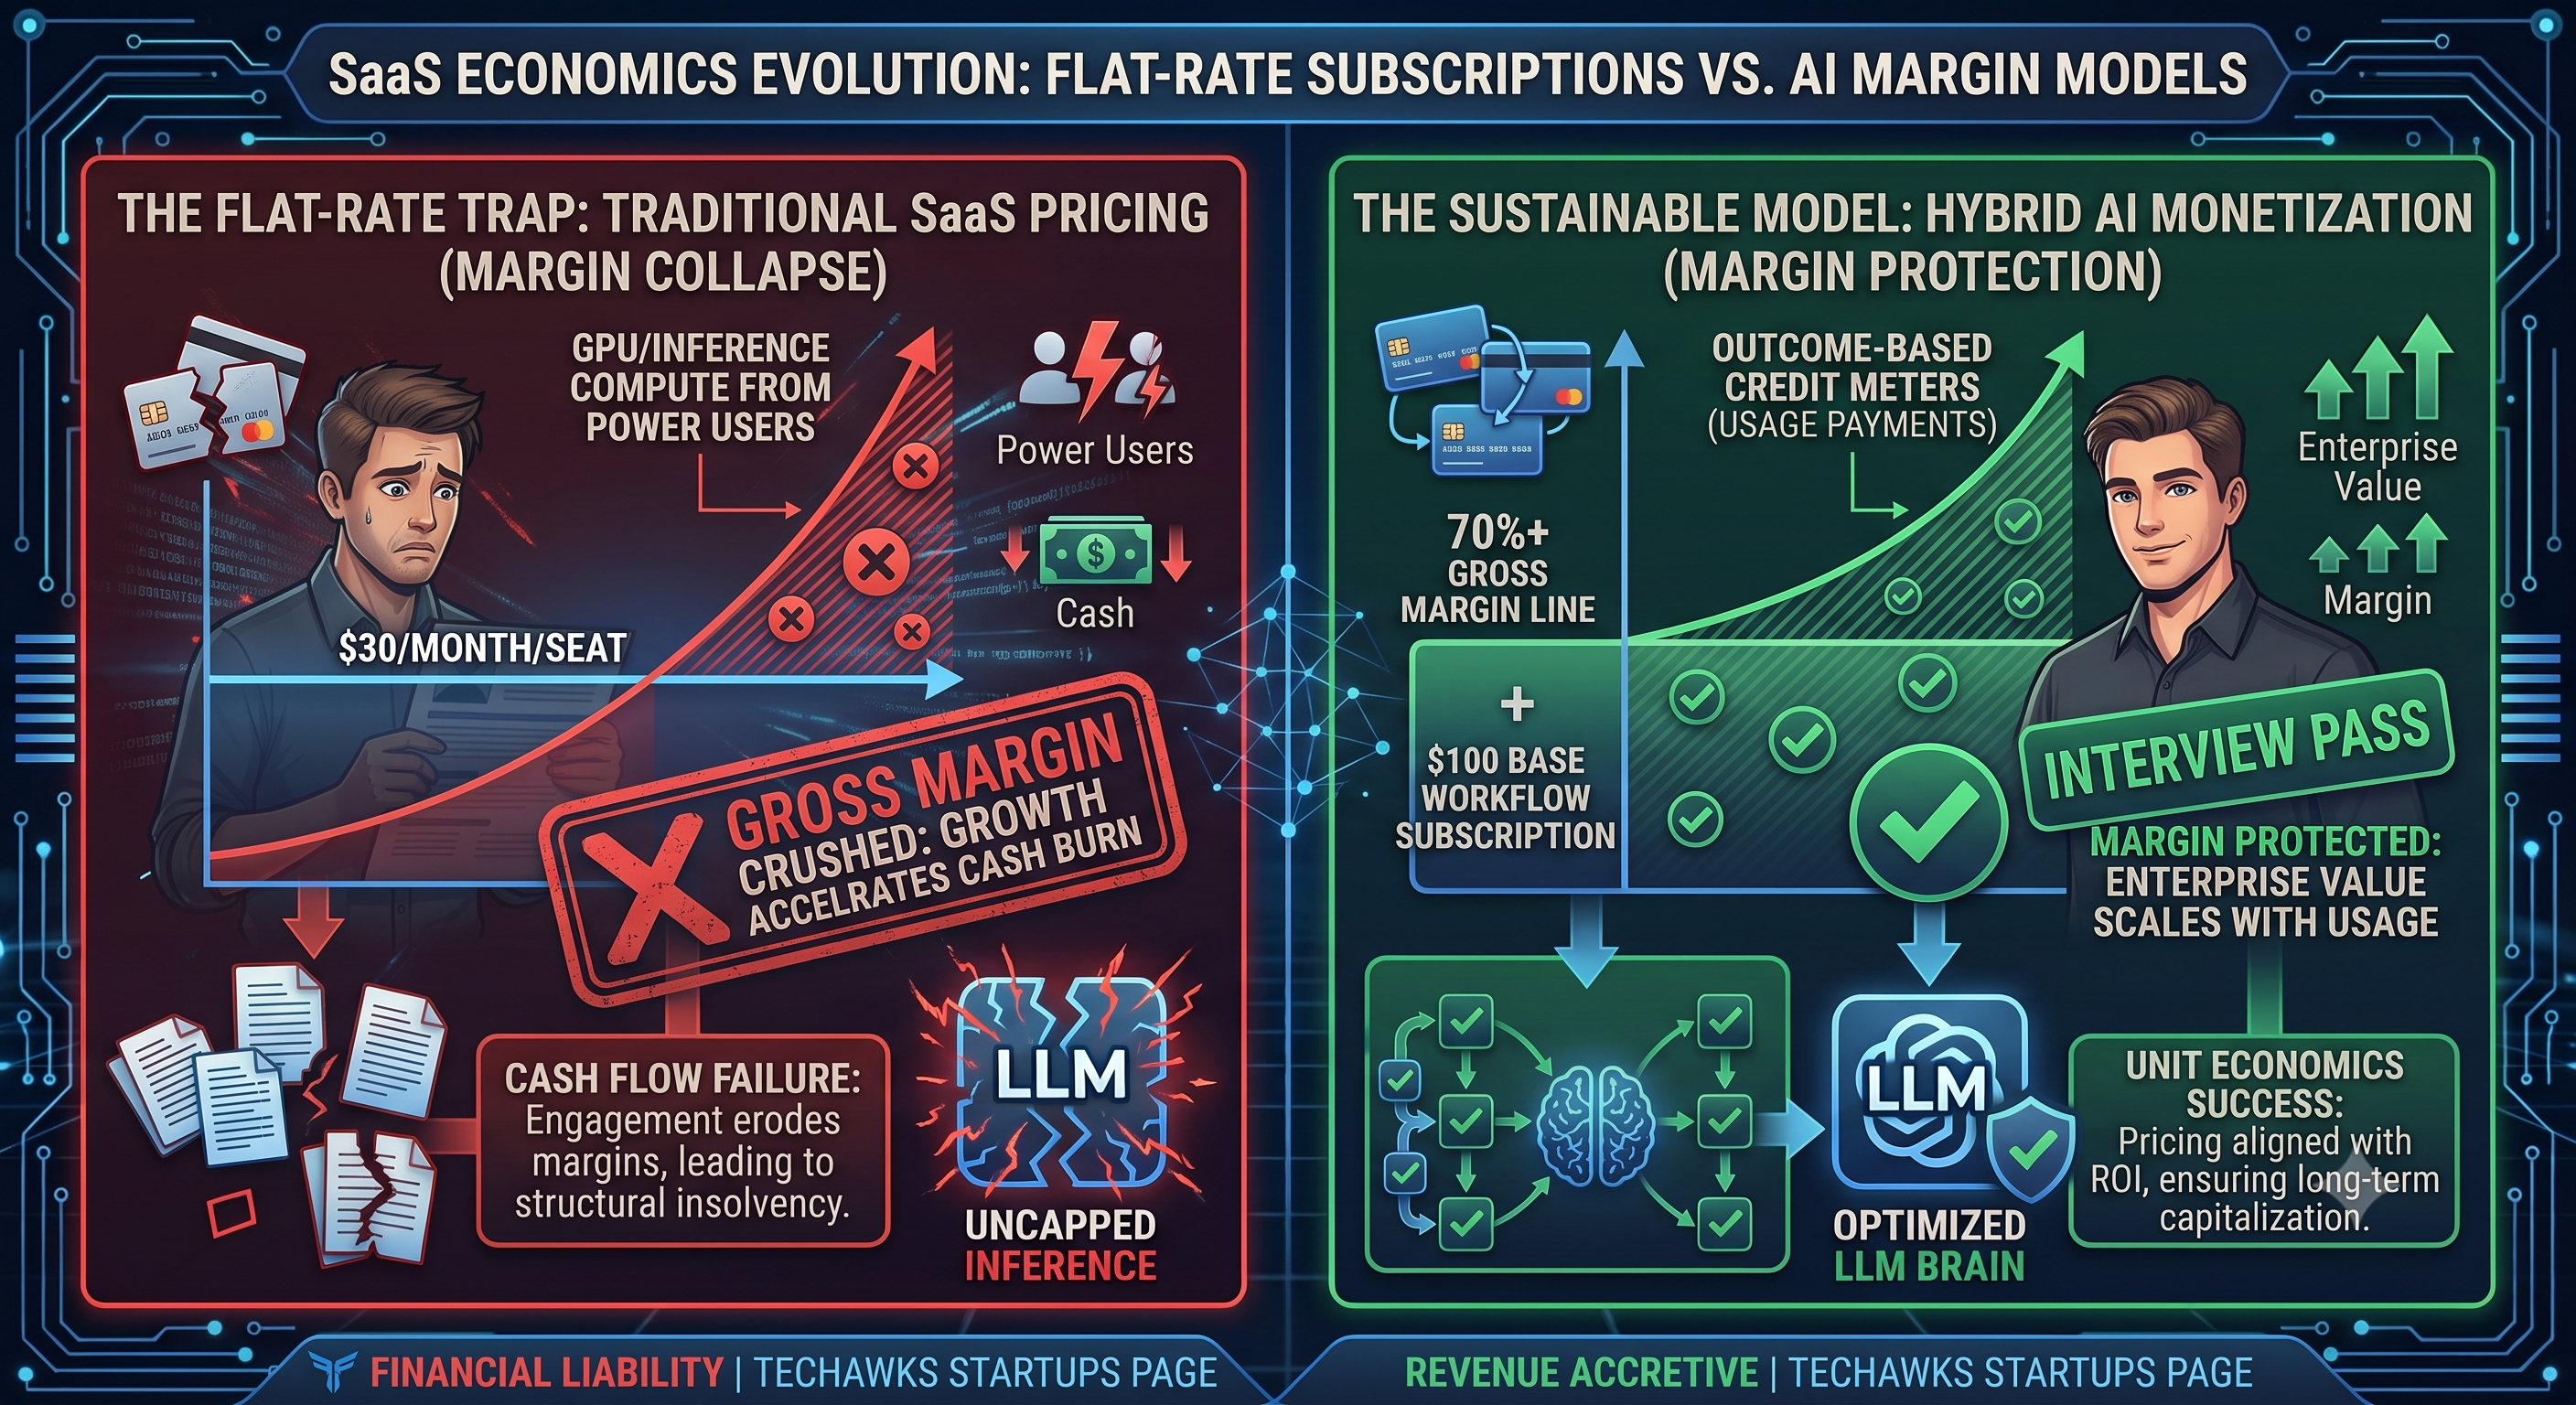 0 Commentarios 0 Acciones 159 Views 0 Vista previa
 -
The Systems of Record Illusion: Why Your "AI-First" Workflow Has Zero Defensibility
Founders are falling into a recurring trap: building a slick, autonomous AI workflow on top of someone else’s data layer and mistaking early user delight for a moat.
When you build an AI-native layer that reads from Salesforce, writes to Jira, or synthesizes data from Workday, you live on rented territory. The moment foundation models improve context handling or an incumbent releases an in-house agentic feature, your startup gets Sherlocked out of the stack.
The brutal reality of modern enterprise software: He who owns the system of record captures the surplus of the workflow.
If a legacy tool holds the source of truth, user identity, and audit compliance, adding intelligence is just an incremental feature for them. For you, it is your entire company.
The Strategic Shift: From "System of Intelligence" to "System of Action & Authority"
To survive the consolidation wave, founders must engineer structural defensibility:
Capture the Canonical State: Stop exporting output back to legacy databases. Design your product so that the final, auditable artifact (the generated contract, the underwritten risk score, the verified ledger) is minted and lives inside your proprietary database schema.
Compound Asymmetric Domain Telemetry: General LLM capabilities are a commodity. Your defensibility comes from behavioral feedback loops: capturing un-scraped domain corrections, domain-specific human rejections, and multi-variable regulatory rules that cannot be crawled from the public web.
Monetize Outcomes, Not Seats: Incumbents are paralyzed by per-seat SaaS pricing because efficiency destroys their top line. Price on business throughput or verified units of work (e.g., claims processed, audits completed), forcing legacy vendors to cannibalize their own revenue models to compete with you.
Don't build an assistant that helps people use legacy software. Build the replacement engine where the work actually terminates.
Discussion Question
Are you trying to replace an incumbent’s database, or are you hoping your interface stays sticky enough before they ship your core feature in their next release?
CTA
Build defensible products, master startup economics, and scale ventures designed to last. Join Startup Founders & Entrepreneurs at Techawks Startups.The Systems of Record Illusion: Why Your "AI-First" Workflow Has Zero Defensibility Founders are falling into a recurring trap: building a slick, autonomous AI workflow on top of someone else’s data layer and mistaking early user delight for a moat. When you build an AI-native layer that reads from Salesforce, writes to Jira, or synthesizes data from Workday, you live on rented territory. The moment foundation models improve context handling or an incumbent releases an in-house agentic feature, your startup gets Sherlocked out of the stack. The brutal reality of modern enterprise software: He who owns the system of record captures the surplus of the workflow. If a legacy tool holds the source of truth, user identity, and audit compliance, adding intelligence is just an incremental feature for them. For you, it is your entire company. The Strategic Shift: From "System of Intelligence" to "System of Action & Authority" To survive the consolidation wave, founders must engineer structural defensibility: Capture the Canonical State: Stop exporting output back to legacy databases. Design your product so that the final, auditable artifact (the generated contract, the underwritten risk score, the verified ledger) is minted and lives inside your proprietary database schema. Compound Asymmetric Domain Telemetry: General LLM capabilities are a commodity. Your defensibility comes from behavioral feedback loops: capturing un-scraped domain corrections, domain-specific human rejections, and multi-variable regulatory rules that cannot be crawled from the public web. Monetize Outcomes, Not Seats: Incumbents are paralyzed by per-seat SaaS pricing because efficiency destroys their top line. Price on business throughput or verified units of work (e.g., claims processed, audits completed), forcing legacy vendors to cannibalize their own revenue models to compete with you. Don't build an assistant that helps people use legacy software. Build the replacement engine where the work actually terminates. Discussion Question Are you trying to replace an incumbent’s database, or are you hoping your interface stays sticky enough before they ship your core feature in their next release? CTA Build defensible products, master startup economics, and scale ventures designed to last. Join Startup Founders & Entrepreneurs at Techawks Startups.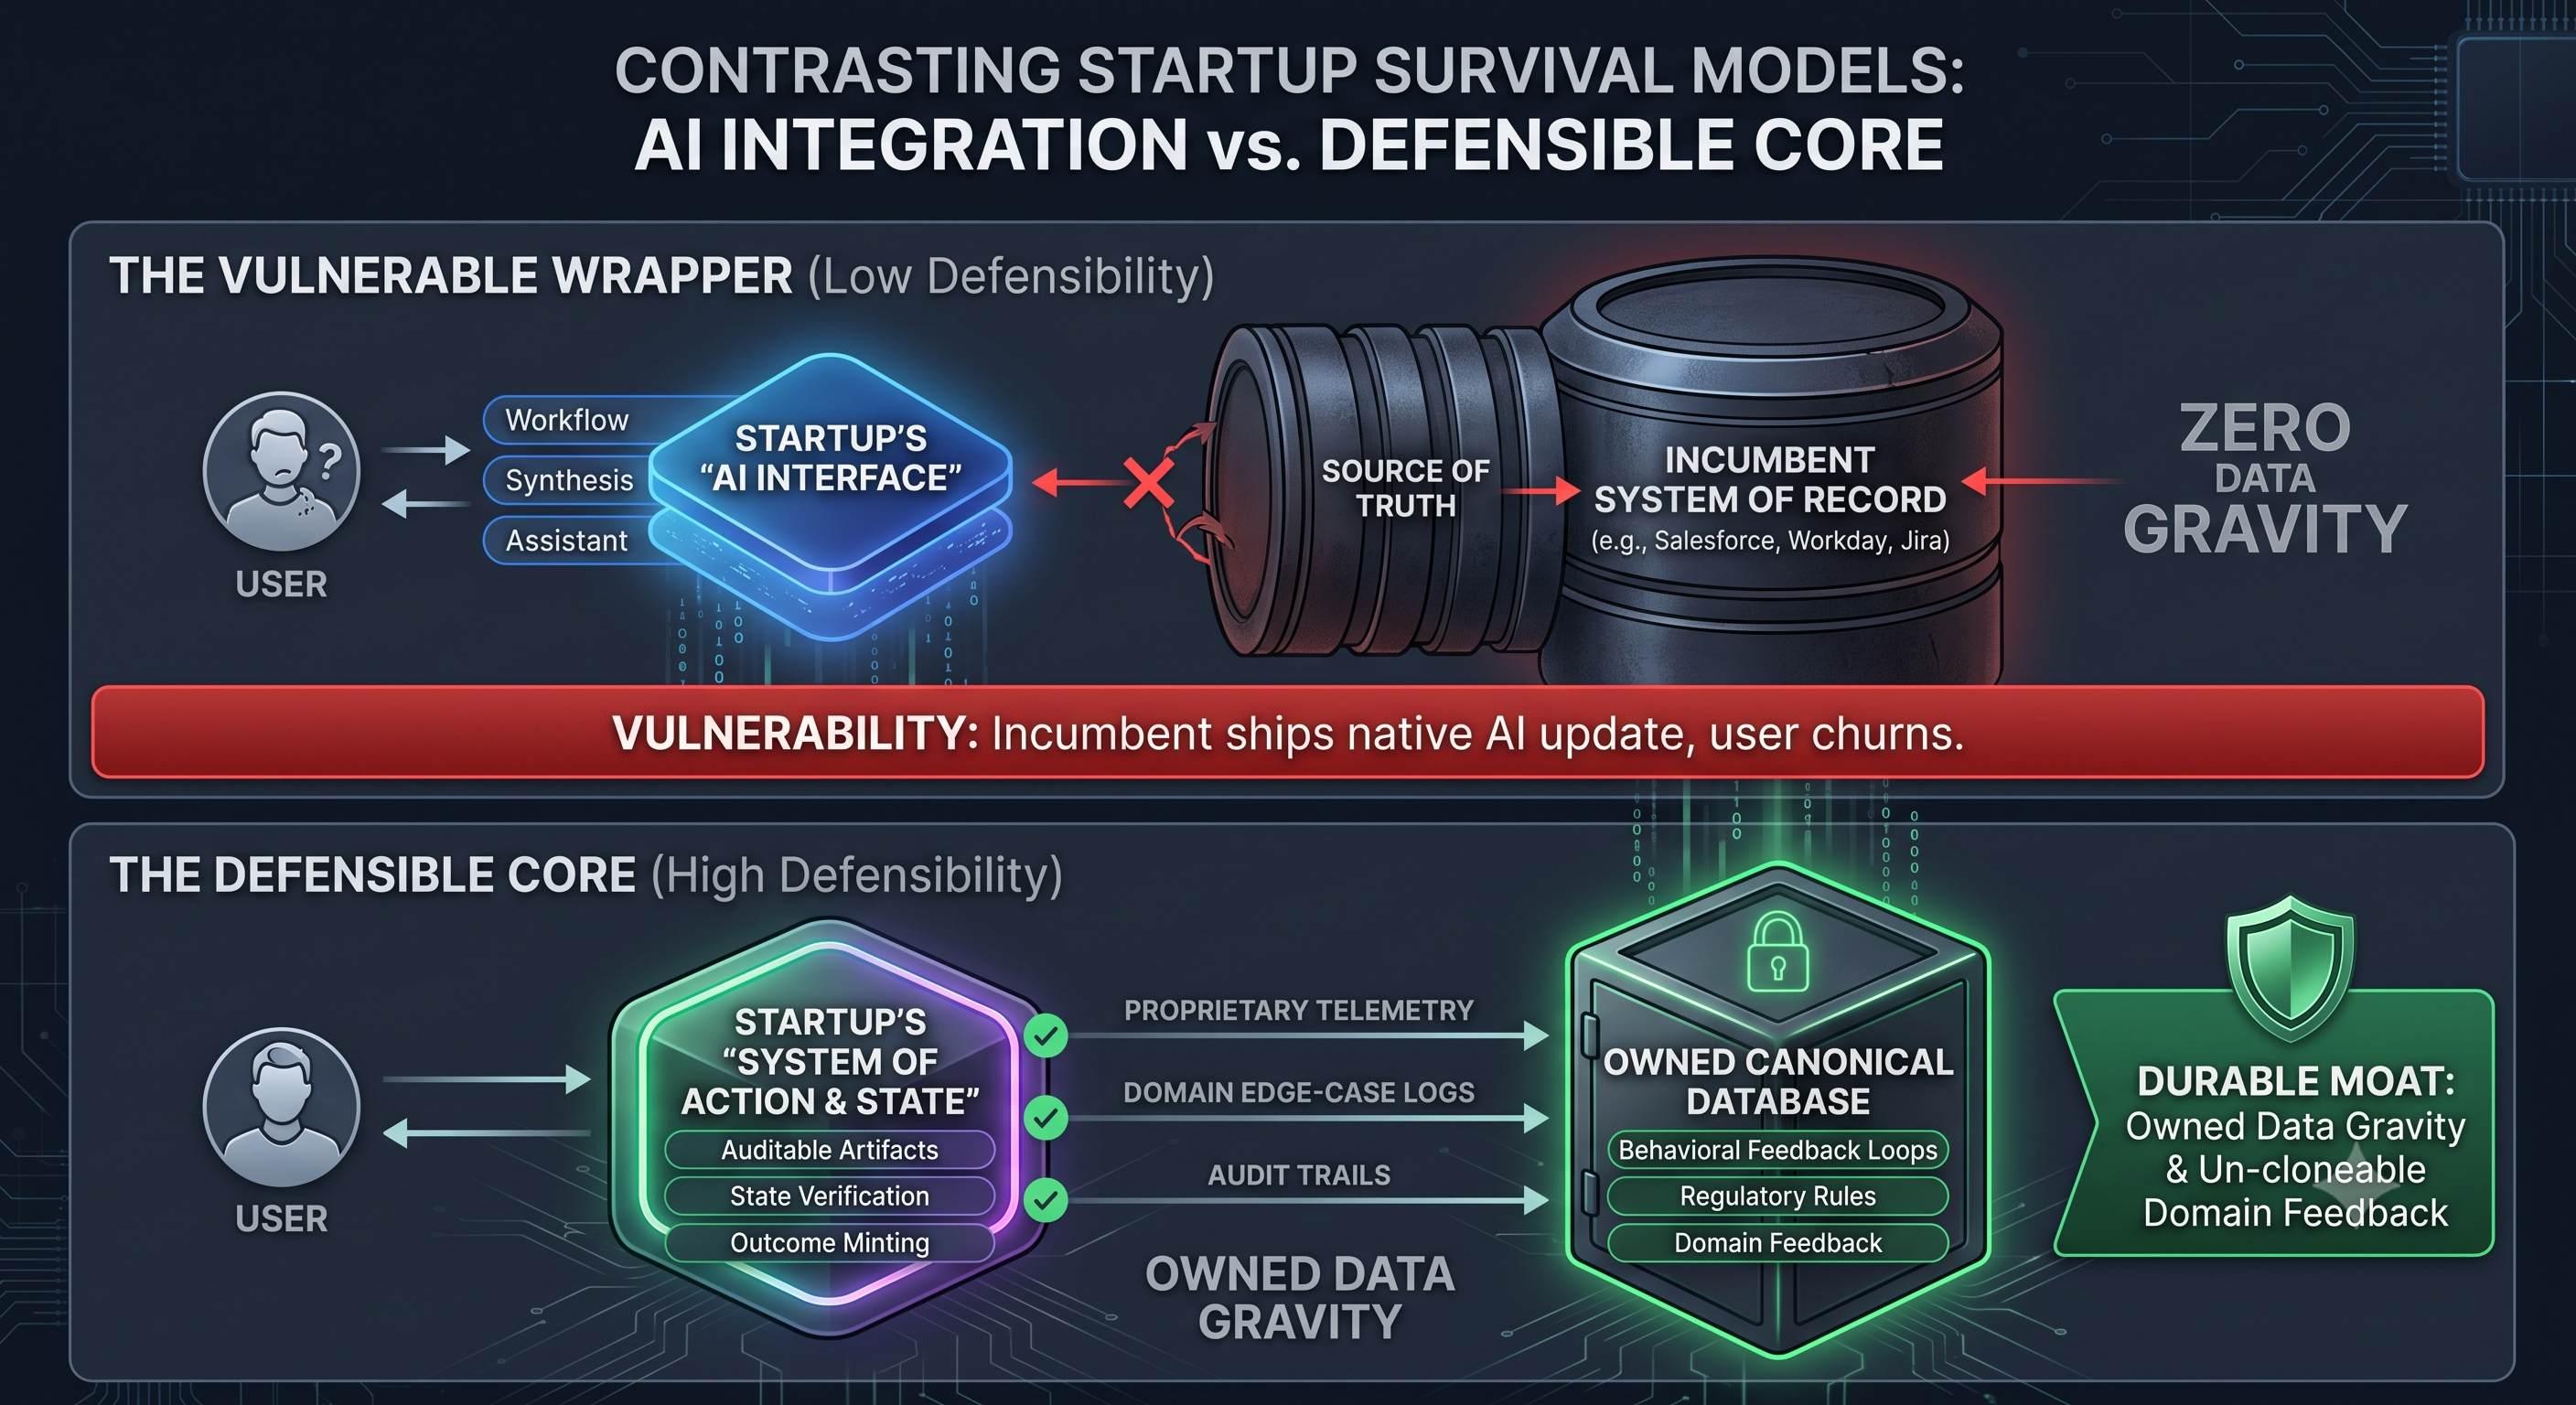 0 Commentarios 0 Acciones 152 Views 0 Vista previa
 -
Per-Seat Pricing Is Cannibalizing Your AI Startup
Founders are still borrowing the classic SaaS playbook: build a tool, launch a $29/user/month tier, and pray for viral seat expansion across enterprise departments.
That playbook was designed for systems of record (like Salesforce or Jira) where more human workers meant more logins. But if your product is an agentic system of work, human headcount is no longer your growth engine—it is your ceiling.
When an AI workflow cuts a client's 10-person customer support or QA team down to two operators, per-seat pricing cuts your contract value by 80% while your compute costs per user skyrocket.
To stop killing your margins and burning enterprise value, restructure your unit economics:
Price for the Outcome, Not the Dashboard Access: Anchor your tiering to the business deliverable your product replaces or generates—resolutions reached, PRs reviewed, documents audited, or campaigns deployed. If you replace $80,000 worth of manual operations, capture value from that delta rather than charging for a login email.
Guard the P90 Compute Cliff: In classical software, marginal cost per user is near zero. In AI products, compute burns real margin. A flat unlimited seat model means your top 10% power users (P90) can easily burn more in model inference and vector retrieval than their entire monthly subscription fee.
Adopt the Hybrid Floor Model: Pure consumption makes revenue volatile; pure seats shrink your contract sizes. Protect your runway with a predictable platform base fee (covering core access and baseline compute) paired with metered outcome bands.
If your product makes teams leaner, your pricing model cannot depend on teams getting larger.
Discussion Question
Are you currently billing customers based on login seats, raw API token pass-throughs, or defined work outcomes—and where is that putting the squeeze on your gross margins?
CTA (Join Startup Founders & Entrepreneurs)
Tired of watching software dogma cap your startup's growth and margin profile?
👉 Join the Techawks Startup Founders & Entrepreneurs Community to dissect real pricing models, master sustainable unit economics, and build resilient ventures alongside seasoned operators:Per-Seat Pricing Is Cannibalizing Your AI Startup Founders are still borrowing the classic SaaS playbook: build a tool, launch a $29/user/month tier, and pray for viral seat expansion across enterprise departments. That playbook was designed for systems of record (like Salesforce or Jira) where more human workers meant more logins. But if your product is an agentic system of work, human headcount is no longer your growth engine—it is your ceiling. When an AI workflow cuts a client's 10-person customer support or QA team down to two operators, per-seat pricing cuts your contract value by 80% while your compute costs per user skyrocket. To stop killing your margins and burning enterprise value, restructure your unit economics: Price for the Outcome, Not the Dashboard Access: Anchor your tiering to the business deliverable your product replaces or generates—resolutions reached, PRs reviewed, documents audited, or campaigns deployed. If you replace $80,000 worth of manual operations, capture value from that delta rather than charging for a login email. Guard the P90 Compute Cliff: In classical software, marginal cost per user is near zero. In AI products, compute burns real margin. A flat unlimited seat model means your top 10% power users (P90) can easily burn more in model inference and vector retrieval than their entire monthly subscription fee. Adopt the Hybrid Floor Model: Pure consumption makes revenue volatile; pure seats shrink your contract sizes. Protect your runway with a predictable platform base fee (covering core access and baseline compute) paired with metered outcome bands. If your product makes teams leaner, your pricing model cannot depend on teams getting larger. Discussion Question Are you currently billing customers based on login seats, raw API token pass-throughs, or defined work outcomes—and where is that putting the squeeze on your gross margins? CTA (Join Startup Founders & Entrepreneurs) Tired of watching software dogma cap your startup's growth and margin profile? 👉 Join the Techawks Startup Founders & Entrepreneurs Community to dissect real pricing models, master sustainable unit economics, and build resilient ventures alongside seasoned operators: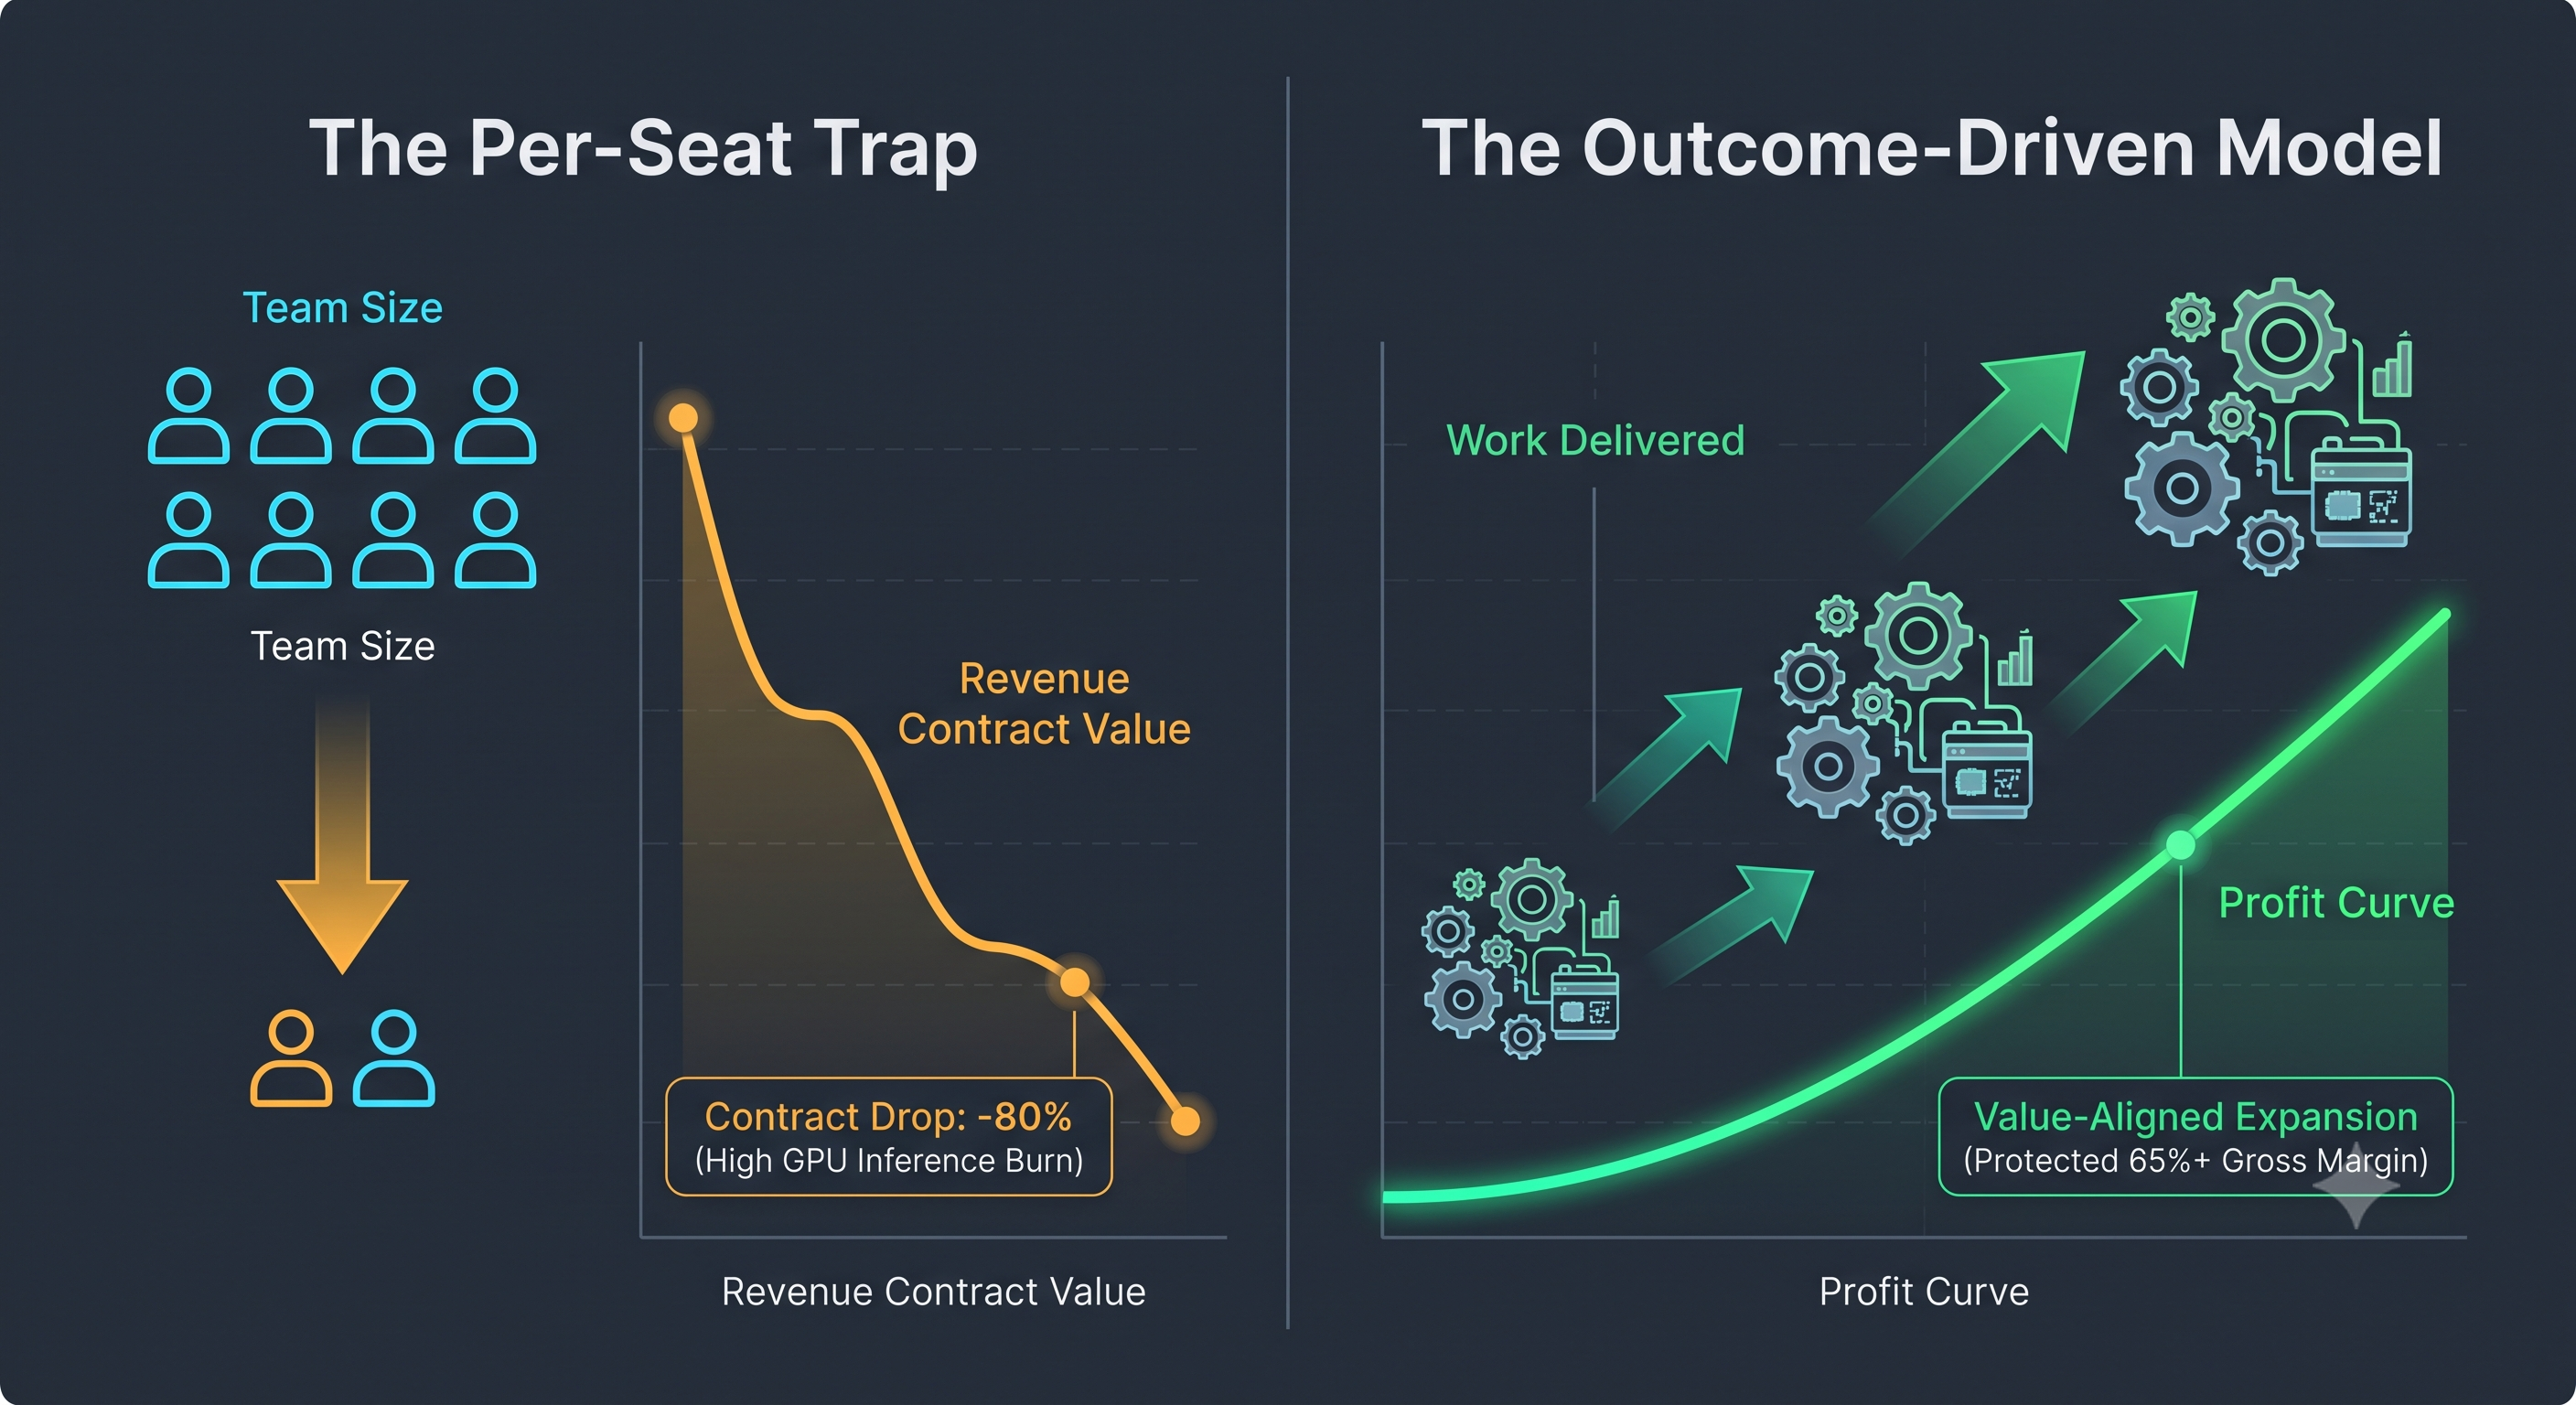 0 Commentarios 0 Acciones 257 Views 0 Vista previa
 -
Stop Burning Cash on Custom Software: The 4-Step AI Prototype-to-Production Checklist for Founders
The venture landscape has shifted dramatically. Investors no longer write blank checks for vague software ideas built on bloated development cycles; they look for rapid market validation, efficient burn multiples, and intelligent use of modern AI primitives.
As a founder, your primary job isn't managing lines of code—it’s proving product-market fit before your runway runs out. To maximize capital efficiency while retaining full control over your product's core IP, use this actionable checklist:
Leverage AI Prototyping & No-Code/Low-Code Layers: Use advanced code-generation tools and composable frameworks to build a clickable, functional prototype that tests user behavior within days rather than months.
Focus Solely on the Core Value Prop: Strip away secondary features, custom admin dashboards, and premature scaling infrastructure. Build only what is necessary to answer your primary customer validation metric.
Integrate Off-the-Shelf APIs Securely: Instead of reinventing the wheel for authentication, payment processing, or basic AI features, leverage robust, enterprise-grade third-party APIs to accelerate time-to-market.
Establish a Lean Architectural Roadmap: Define clear triggers for when you actually need to transition from your prototype to a dedicated engineering team, ensuring you only hire once product-market fit signals are validated.
Discussion Question: What has been your biggest hurdle when trying to balance rapid MVP development with lean cash management—managing technical debt from early shortcuts or finding the right balance of outsourced vs. in-house engineering? Share your thoughts below!
CTA (Join Startup Founders & Entrepreneurs): Ready to scale smarter? Join Startup Founders & Entrepreneurs to connect with peers, access exclusive pitch strategies, and accelerate your startup's growth.Stop Burning Cash on Custom Software: The 4-Step AI Prototype-to-Production Checklist for Founders The venture landscape has shifted dramatically. Investors no longer write blank checks for vague software ideas built on bloated development cycles; they look for rapid market validation, efficient burn multiples, and intelligent use of modern AI primitives. As a founder, your primary job isn't managing lines of code—it’s proving product-market fit before your runway runs out. To maximize capital efficiency while retaining full control over your product's core IP, use this actionable checklist: Leverage AI Prototyping & No-Code/Low-Code Layers: Use advanced code-generation tools and composable frameworks to build a clickable, functional prototype that tests user behavior within days rather than months. Focus Solely on the Core Value Prop: Strip away secondary features, custom admin dashboards, and premature scaling infrastructure. Build only what is necessary to answer your primary customer validation metric. Integrate Off-the-Shelf APIs Securely: Instead of reinventing the wheel for authentication, payment processing, or basic AI features, leverage robust, enterprise-grade third-party APIs to accelerate time-to-market. Establish a Lean Architectural Roadmap: Define clear triggers for when you actually need to transition from your prototype to a dedicated engineering team, ensuring you only hire once product-market fit signals are validated. Discussion Question: What has been your biggest hurdle when trying to balance rapid MVP development with lean cash management—managing technical debt from early shortcuts or finding the right balance of outsourced vs. in-house engineering? Share your thoughts below! CTA (Join Startup Founders & Entrepreneurs): Ready to scale smarter? Join Startup Founders & Entrepreneurs to connect with peers, access exclusive pitch strategies, and accelerate your startup's growth.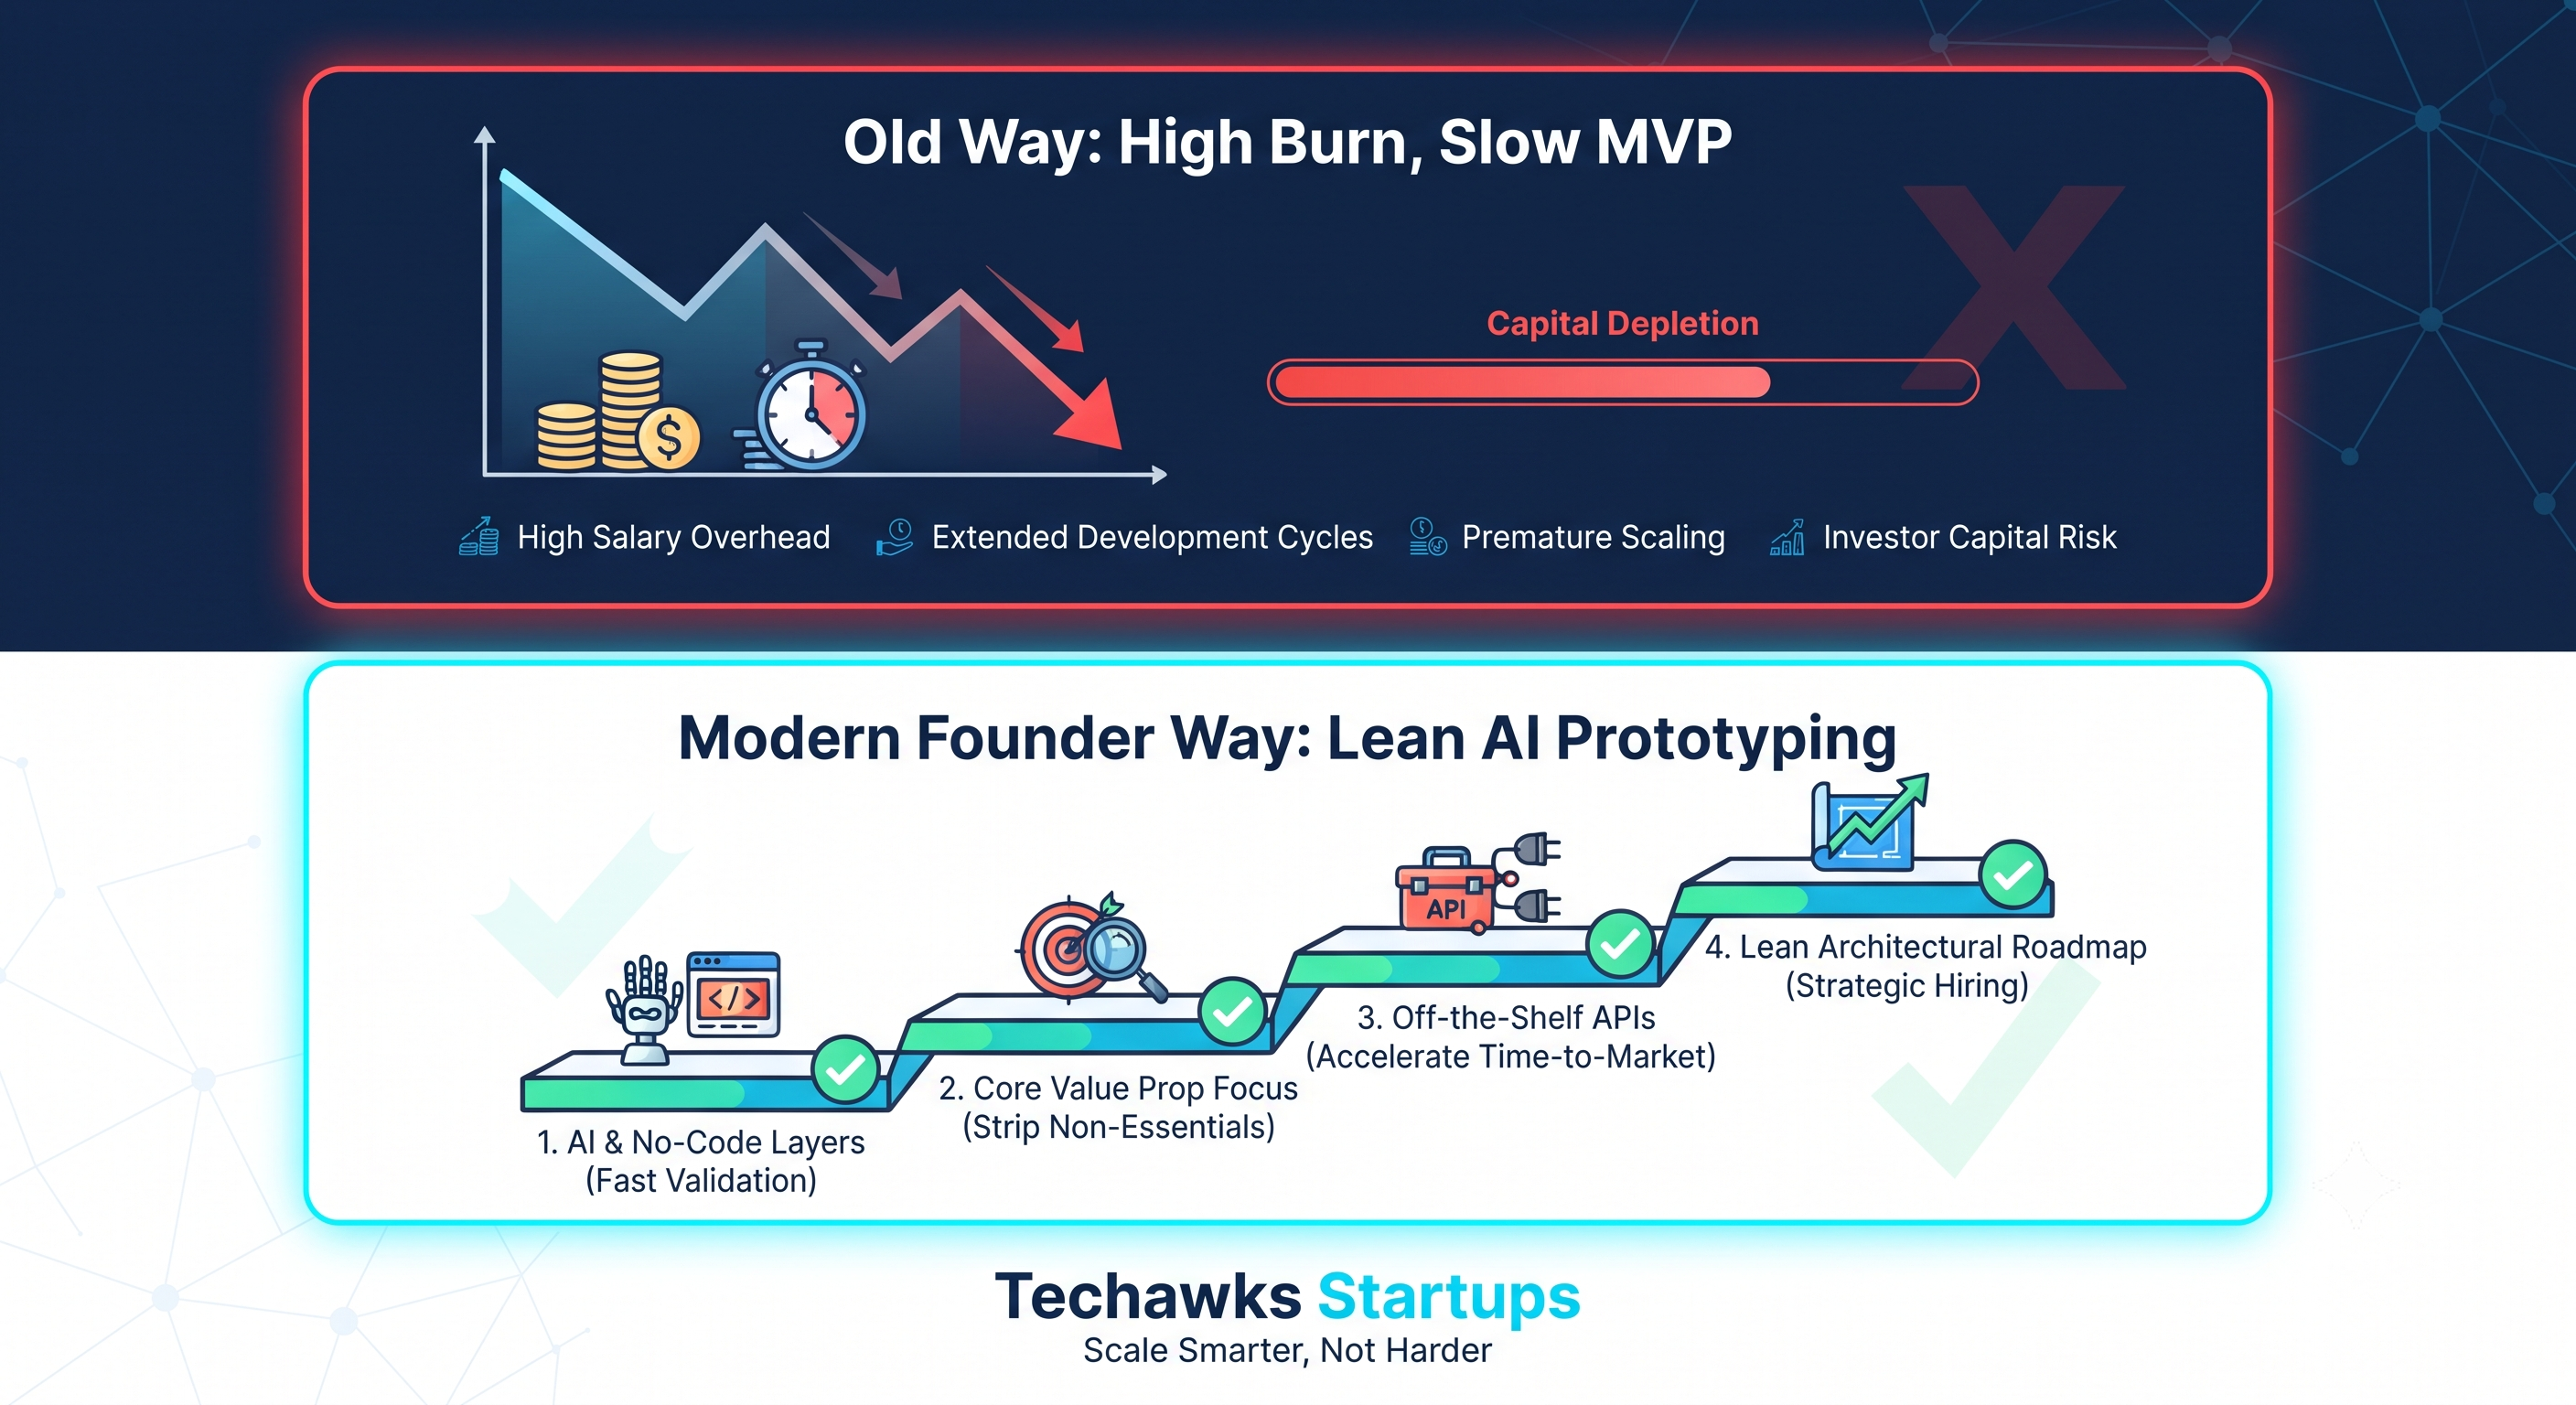 0 Commentarios 0 Acciones 223 Views 0 Vista previa
 -
The 80% Gross Margin Illusion: Why AI-Native Startups Must Redesign Their Unit Economics
For fifteen years, cloud software enjoyed an economic cheat code: near-zero marginal cost of distribution. Once the code was deployed, serving user #10,000 cost virtually the same as serving user #100.
In the AI-native wave, that rule no longer applies.
Every user action triggers an inference call, data retrieval loop, or context-evaluation pipeline. As usage scales, compute costs scale linearly alongside it. When AI companies price like traditional SaaS—charging a flat $29 or $49/seat/month while offering unmetered reasoning—power users quickly consume $50+ in monthly cloud and model inference.
The result is Inference Margin Decay: high top-line ARR growth hiding 35% to 55% blended gross margins.
The 3 Pillars of AI Unit Economics for Founders:
Incorporate Compute Directly into COGS
Treating GPU tokens and model API calls as discretionary R&D or operational overhead masks your true unit profitability. Compute must sit inside Cost of Goods Sold (COGS). Your key metric isn't just gross margin; it is Gross Margin After Compute (GMAC). Sustainable AI startups target a 60%–70% GMAC by Series A.
Move from Per-Seat to Outcome or Work-Unit Pricing
Flat seat licenses incentivize users to maximize heavy agent workflows on fixed fees. Transition to hybrid pricing: a base platform fee for UI/access paired with consumption credits or outcome-based billing (e.g., per resolved ticket, per audited contract, or per completed reconciliation). Align your revenue directly with the compute intensity of the task.
Establish Semantic Cache & Model Tiering Gateways
Route queries dynamically. Don't hit an expensive frontier reasoning model for intent classification or deterministic formatting. Use small, fine-tuned open models (SLMs) or vector caches for 70% of routine workflows, reserving large reasoning models strictly for complex synthesis.
A high-growth startup with 40% gross margins is not a software company—it's an IT consultancy disguised as software. Real venture defensibility is building high-margin workflow software around optimized, cost-controlled inference.
Discussion Question
Founders building AI products: How are you managing inference unit economics—are you passing usage directly via hybrid token/credit pricing, caching aggressively, or absorbing the margins until you hit scale? Drop your pricing lessons below.
CTA
Ready to build sustainable venture-scale companies with airtight fundamentals?
👉 Join the Techawks Startup Founders & Entrepreneurs Community to discuss unit economics, go-to-market strategies, and fundraising playbooks with fellow operators.The 80% Gross Margin Illusion: Why AI-Native Startups Must Redesign Their Unit Economics For fifteen years, cloud software enjoyed an economic cheat code: near-zero marginal cost of distribution. Once the code was deployed, serving user #10,000 cost virtually the same as serving user #100. In the AI-native wave, that rule no longer applies. Every user action triggers an inference call, data retrieval loop, or context-evaluation pipeline. As usage scales, compute costs scale linearly alongside it. When AI companies price like traditional SaaS—charging a flat $29 or $49/seat/month while offering unmetered reasoning—power users quickly consume $50+ in monthly cloud and model inference. The result is Inference Margin Decay: high top-line ARR growth hiding 35% to 55% blended gross margins. The 3 Pillars of AI Unit Economics for Founders: Incorporate Compute Directly into COGS Treating GPU tokens and model API calls as discretionary R&D or operational overhead masks your true unit profitability. Compute must sit inside Cost of Goods Sold (COGS). Your key metric isn't just gross margin; it is Gross Margin After Compute (GMAC). Sustainable AI startups target a 60%–70% GMAC by Series A. Move from Per-Seat to Outcome or Work-Unit Pricing Flat seat licenses incentivize users to maximize heavy agent workflows on fixed fees. Transition to hybrid pricing: a base platform fee for UI/access paired with consumption credits or outcome-based billing (e.g., per resolved ticket, per audited contract, or per completed reconciliation). Align your revenue directly with the compute intensity of the task. Establish Semantic Cache & Model Tiering Gateways Route queries dynamically. Don't hit an expensive frontier reasoning model for intent classification or deterministic formatting. Use small, fine-tuned open models (SLMs) or vector caches for 70% of routine workflows, reserving large reasoning models strictly for complex synthesis. A high-growth startup with 40% gross margins is not a software company—it's an IT consultancy disguised as software. Real venture defensibility is building high-margin workflow software around optimized, cost-controlled inference. Discussion Question Founders building AI products: How are you managing inference unit economics—are you passing usage directly via hybrid token/credit pricing, caching aggressively, or absorbing the margins until you hit scale? Drop your pricing lessons below. CTA Ready to build sustainable venture-scale companies with airtight fundamentals? 👉 Join the Techawks Startup Founders & Entrepreneurs Community to discuss unit economics, go-to-market strategies, and fundraising playbooks with fellow operators. 0 Commentarios 0 Acciones 344 Views 0 Vista previa
 -
The Per-Seat Pricing Trap: Why Traditional SaaS Economics Are Breaking Early-Stage AI Startups
For fifteen years, B2B SaaS operated on a simple mathematical truth: marginal cost per user was practically zero. Gross margins sat comfortably between 75% and 85%. In that world, an engaged user who spent 10 hours a day in your app cost the same as one who logged in once a week.
In the AI era, that assumption is dead.
Every reasoning step, vector lookup, and agentic tool call incurs variable GPU and token compute costs. Because inference costs scale directly with activity, applying flat per-seat SaaS models produces a fatal inversion: your power users become your least profitable accounts.
If a power customer runs 40 complex agent workflows daily, their underlying compute can easily hit $45/month. On a $30 flat monthly seat, you are subsidizing their operations at negative contribution margins.
How Resilient Founders Are Structuring AI Unit Economics
Top-performing founders are moving away from traditional SaaS metrics and redesigning their commercial architecture around compute-aware packaging:
Calculate "Contribution Margin LTV" (CM-LTV):Standard LTV formulas ({ARPU X Gross Margin}) /Churn}) overstate customer value when marginal costs fluctuate. Founders must deduct customer-specific inference, orchestration, and storage costs from ARPU before calculating payback periods.
Hybrid Base + Work-Unit Billing:
Pure consumption pricing causes enterprise procurement friction due to bill shock, while pure per-seat pricing destroys margins. The winning model is a stable platform seat coupled with value-metric limits (e.g., "resolved tickets," "verified reconciliation reports," or "credits") with automatic overage pricing.
Model Tiering and Fallback Routing:
Route standard workflow prompts to smaller, quantized, or distilled open-weight models (costing fractions of a cent) and reserve expensive frontier reasoning models exclusively for high-ambiguity exceptions.
Software is no longer just digital real estate; it is active digital labor. If your pricing does not reflect the cost of the work being performed, growth accelerates your burn rate instead of your runway.
Discussion Question
How is your startup structuring AI pricing: flat subscription tiers with usage caps, pure outcome-based pricing, or a hybrid credit model? What customer pushback have you encountered?
CTA
Scale your startup with defensible unit economics and sustainable growth models. Join fellow founders, venture operators, and tech leaders inside Startup Founders & Entrepreneurs to dissect cap tables, go-to-market strategies, and pricing playbooks.The Per-Seat Pricing Trap: Why Traditional SaaS Economics Are Breaking Early-Stage AI Startups For fifteen years, B2B SaaS operated on a simple mathematical truth: marginal cost per user was practically zero. Gross margins sat comfortably between 75% and 85%. In that world, an engaged user who spent 10 hours a day in your app cost the same as one who logged in once a week. In the AI era, that assumption is dead. Every reasoning step, vector lookup, and agentic tool call incurs variable GPU and token compute costs. Because inference costs scale directly with activity, applying flat per-seat SaaS models produces a fatal inversion: your power users become your least profitable accounts. If a power customer runs 40 complex agent workflows daily, their underlying compute can easily hit $45/month. On a $30 flat monthly seat, you are subsidizing their operations at negative contribution margins. How Resilient Founders Are Structuring AI Unit Economics Top-performing founders are moving away from traditional SaaS metrics and redesigning their commercial architecture around compute-aware packaging: Calculate "Contribution Margin LTV" (CM-LTV):Standard LTV formulas ({ARPU X Gross Margin}) /Churn}) overstate customer value when marginal costs fluctuate. Founders must deduct customer-specific inference, orchestration, and storage costs from ARPU before calculating payback periods. Hybrid Base + Work-Unit Billing: Pure consumption pricing causes enterprise procurement friction due to bill shock, while pure per-seat pricing destroys margins. The winning model is a stable platform seat coupled with value-metric limits (e.g., "resolved tickets," "verified reconciliation reports," or "credits") with automatic overage pricing. Model Tiering and Fallback Routing: Route standard workflow prompts to smaller, quantized, or distilled open-weight models (costing fractions of a cent) and reserve expensive frontier reasoning models exclusively for high-ambiguity exceptions. Software is no longer just digital real estate; it is active digital labor. If your pricing does not reflect the cost of the work being performed, growth accelerates your burn rate instead of your runway. Discussion Question How is your startup structuring AI pricing: flat subscription tiers with usage caps, pure outcome-based pricing, or a hybrid credit model? What customer pushback have you encountered? CTA Scale your startup with defensible unit economics and sustainable growth models. Join fellow founders, venture operators, and tech leaders inside Startup Founders & Entrepreneurs to dissect cap tables, go-to-market strategies, and pricing playbooks. 0 Commentarios 0 Acciones 252 Views 0 Vista previa
 -
The 80% SaaS Margin Era Is Dead: The Founder's Guide to AI Unit Economics
Traditional SaaS possessed a near-frictionless business model: write software once, host it cheaply, and watch each incremental customer drop straight to the bottom line. The marginal cost of a database row was effectively zero.
AI-native and vertical SaaS breaks this economic law. Every user interaction triggers real, measurable GPU compute that directly inflates your Cost of Goods Sold (COGS).
If your top 10% of power users consume 60% of your inference tokens under a flat monthly subscription, growth doesn’t bring scale—it brings cash drain.
The Three Structural Margin Traps
The Seat vs. Token Arbitrage Trap: Pricing your product per seat while your infrastructure bills scale on context window length and token volume creates an unhedged liability.
Using Frontier Models for Commodity Logic: Running 70B+ or frontier reasoning calls on routing, extraction, classification, and predictable formatting bleeds cash for zero customer-perceived upside.
Hidden Ingestion & Retry Overheads: Founders often calculate only the sticker price of a prompt/completion API call, forgetting that system retries, complex JSON schema enforcements, prompt-bloat, and eval suites add 20–50% on top of raw API bills.
How Defensible Founders Engineer Sustainable Margins:
Decouple Pricing from Fixed Seats: Transition to hybrid or outcome-based pricing (base platform fee + credit tiers or metered workload volume). Protect your downside by capping open-ended generation behind token allowances.
Implement Inference Routing Cascades: Never let an expensive reasoning engine touch a raw customer query first. Route input through a sub-3B local/distilled model for intent classification. Solve 70% of mundane tasks with specialized, fine-tuned SLMs (Small Language Models), escalating only complex, high-entropy logic to frontier APIs.
Track Margin Attribution by Feature, Not by Company: If you don't know the exact compute cost of each specific feature and user tier in your product, you can't distinguish between your growth drivers and margin incinerators.
Investors are no longer rewarding top-line ARR that behaves like outsourced consulting. The founders winning today build software where each new customer actually increases gross margin efficiency.
Discussion Question
Have you shifted away from purely seat-based pricing toward consumption/workload-based tiers, or are you absorbing variable inference costs inside your subscription model?
CTA (Join Startup Founders & Entrepreneurs)
Navigating early-stage unit economics, defensible moats, and technical growth architecture? Join the Startup Founders & Entrepreneurs community to dissect cap tables, pricing models, and production margins with fellow operators.The 80% SaaS Margin Era Is Dead: The Founder's Guide to AI Unit Economics Traditional SaaS possessed a near-frictionless business model: write software once, host it cheaply, and watch each incremental customer drop straight to the bottom line. The marginal cost of a database row was effectively zero. AI-native and vertical SaaS breaks this economic law. Every user interaction triggers real, measurable GPU compute that directly inflates your Cost of Goods Sold (COGS). If your top 10% of power users consume 60% of your inference tokens under a flat monthly subscription, growth doesn’t bring scale—it brings cash drain. The Three Structural Margin Traps The Seat vs. Token Arbitrage Trap: Pricing your product per seat while your infrastructure bills scale on context window length and token volume creates an unhedged liability. Using Frontier Models for Commodity Logic: Running 70B+ or frontier reasoning calls on routing, extraction, classification, and predictable formatting bleeds cash for zero customer-perceived upside. Hidden Ingestion & Retry Overheads: Founders often calculate only the sticker price of a prompt/completion API call, forgetting that system retries, complex JSON schema enforcements, prompt-bloat, and eval suites add 20–50% on top of raw API bills. How Defensible Founders Engineer Sustainable Margins: Decouple Pricing from Fixed Seats: Transition to hybrid or outcome-based pricing (base platform fee + credit tiers or metered workload volume). Protect your downside by capping open-ended generation behind token allowances. Implement Inference Routing Cascades: Never let an expensive reasoning engine touch a raw customer query first. Route input through a sub-3B local/distilled model for intent classification. Solve 70% of mundane tasks with specialized, fine-tuned SLMs (Small Language Models), escalating only complex, high-entropy logic to frontier APIs. Track Margin Attribution by Feature, Not by Company: If you don't know the exact compute cost of each specific feature and user tier in your product, you can't distinguish between your growth drivers and margin incinerators. Investors are no longer rewarding top-line ARR that behaves like outsourced consulting. The founders winning today build software where each new customer actually increases gross margin efficiency. Discussion Question Have you shifted away from purely seat-based pricing toward consumption/workload-based tiers, or are you absorbing variable inference costs inside your subscription model? CTA (Join Startup Founders & Entrepreneurs) Navigating early-stage unit economics, defensible moats, and technical growth architecture? Join the Startup Founders & Entrepreneurs community to dissect cap tables, pricing models, and production margins with fellow operators. 0 Commentarios 0 Acciones 211 Views 0 Vista previa
 -
Why 80% of Enterprise "AI Agent" Pilots Fail Before Production (And the 3-Layer Fix)
We are witnessing a massive transition in B2B software: the shift from generative copilot sidebars to autonomous workflow execution.
Industry research projects that by year-end, over 40% of enterprise business suites will incorporate autonomous workflow agents. Yet, founders consistently run into the same wall when closing mid-market and enterprise deals: Decision Paralysis & Trust Deficits.
Why? Because when a chatbot hallucinates, a user chuckles. When an autonomous agent hallucinates a database write, an API trigger, or a customer discount, someone gets fired.If you want enterprise buyers to sign five- and six-figure contracts for agentic systems, you must design for verifiability and governance from day zero.
The 3-Layer Architecture Enterprise Buyers Actually Sign Off On
1. Explicit Autonomy Boundaries (Deterministic Routing)
Never let an agent guess what it is allowed to execute. Split your actions into two distinct categories:
Safe Actions (Autonomous): Read-only queries, internal drafting, log filtering, data indexing.
Impact Actions (Gated): External emails, customer-facing refunds, schema mutations, payments.
Every impact action must hit a deterministic state machine with a human-in-the-loop (HITL) interrupt before execution.
2. Scoped Delegation over Omnipresent Access
Enterprise CISOs reject agents that request broad API tokens. Build your product around protocols like MCP (Model Context Protocol) or per-tenant OAuth token scoping. If an agent only needs to draft an update in a CRM, it must never carry write permissions to the billing module.
3. Immutable Telemetry & Replayability
You cannot sell an enterprise "black box". Your system needs:
Full trace logs of every reasoning step and tool call.
State checkpointing that allows engineering teams to pause, inspect, and replay any failed run without re-running entire workflows.
The Founder Takeaway:
Stop pitching "unlimited autonomous intelligence." Pitch governed efficiency with zero unmonitored blast radius. That is what gets procurement signatures.
Discussion Question
For technical founders: Are you building human-in-the-loop approval gates directly inside your core product workflows, or treating observability as a post-launch add-on?
CTA
Join Startup Founders & EntrepreneursConnect with hundreds of early-stage operators, access actionable playbooks, and master enterprise-ready product architecture. Join the Techawks Startups community todayWhy 80% of Enterprise "AI Agent" Pilots Fail Before Production (And the 3-Layer Fix) We are witnessing a massive transition in B2B software: the shift from generative copilot sidebars to autonomous workflow execution. Industry research projects that by year-end, over 40% of enterprise business suites will incorporate autonomous workflow agents. Yet, founders consistently run into the same wall when closing mid-market and enterprise deals: Decision Paralysis & Trust Deficits. Why? Because when a chatbot hallucinates, a user chuckles. When an autonomous agent hallucinates a database write, an API trigger, or a customer discount, someone gets fired.If you want enterprise buyers to sign five- and six-figure contracts for agentic systems, you must design for verifiability and governance from day zero. The 3-Layer Architecture Enterprise Buyers Actually Sign Off On 1. Explicit Autonomy Boundaries (Deterministic Routing) Never let an agent guess what it is allowed to execute. Split your actions into two distinct categories: Safe Actions (Autonomous): Read-only queries, internal drafting, log filtering, data indexing. Impact Actions (Gated): External emails, customer-facing refunds, schema mutations, payments. Every impact action must hit a deterministic state machine with a human-in-the-loop (HITL) interrupt before execution. 2. Scoped Delegation over Omnipresent Access Enterprise CISOs reject agents that request broad API tokens. Build your product around protocols like MCP (Model Context Protocol) or per-tenant OAuth token scoping. If an agent only needs to draft an update in a CRM, it must never carry write permissions to the billing module. 3. Immutable Telemetry & Replayability You cannot sell an enterprise "black box". Your system needs: Full trace logs of every reasoning step and tool call. State checkpointing that allows engineering teams to pause, inspect, and replay any failed run without re-running entire workflows. The Founder Takeaway: Stop pitching "unlimited autonomous intelligence." Pitch governed efficiency with zero unmonitored blast radius. That is what gets procurement signatures. Discussion Question For technical founders: Are you building human-in-the-loop approval gates directly inside your core product workflows, or treating observability as a post-launch add-on? CTA Join Startup Founders & EntrepreneursConnect with hundreds of early-stage operators, access actionable playbooks, and master enterprise-ready product architecture. Join the Techawks Startups community today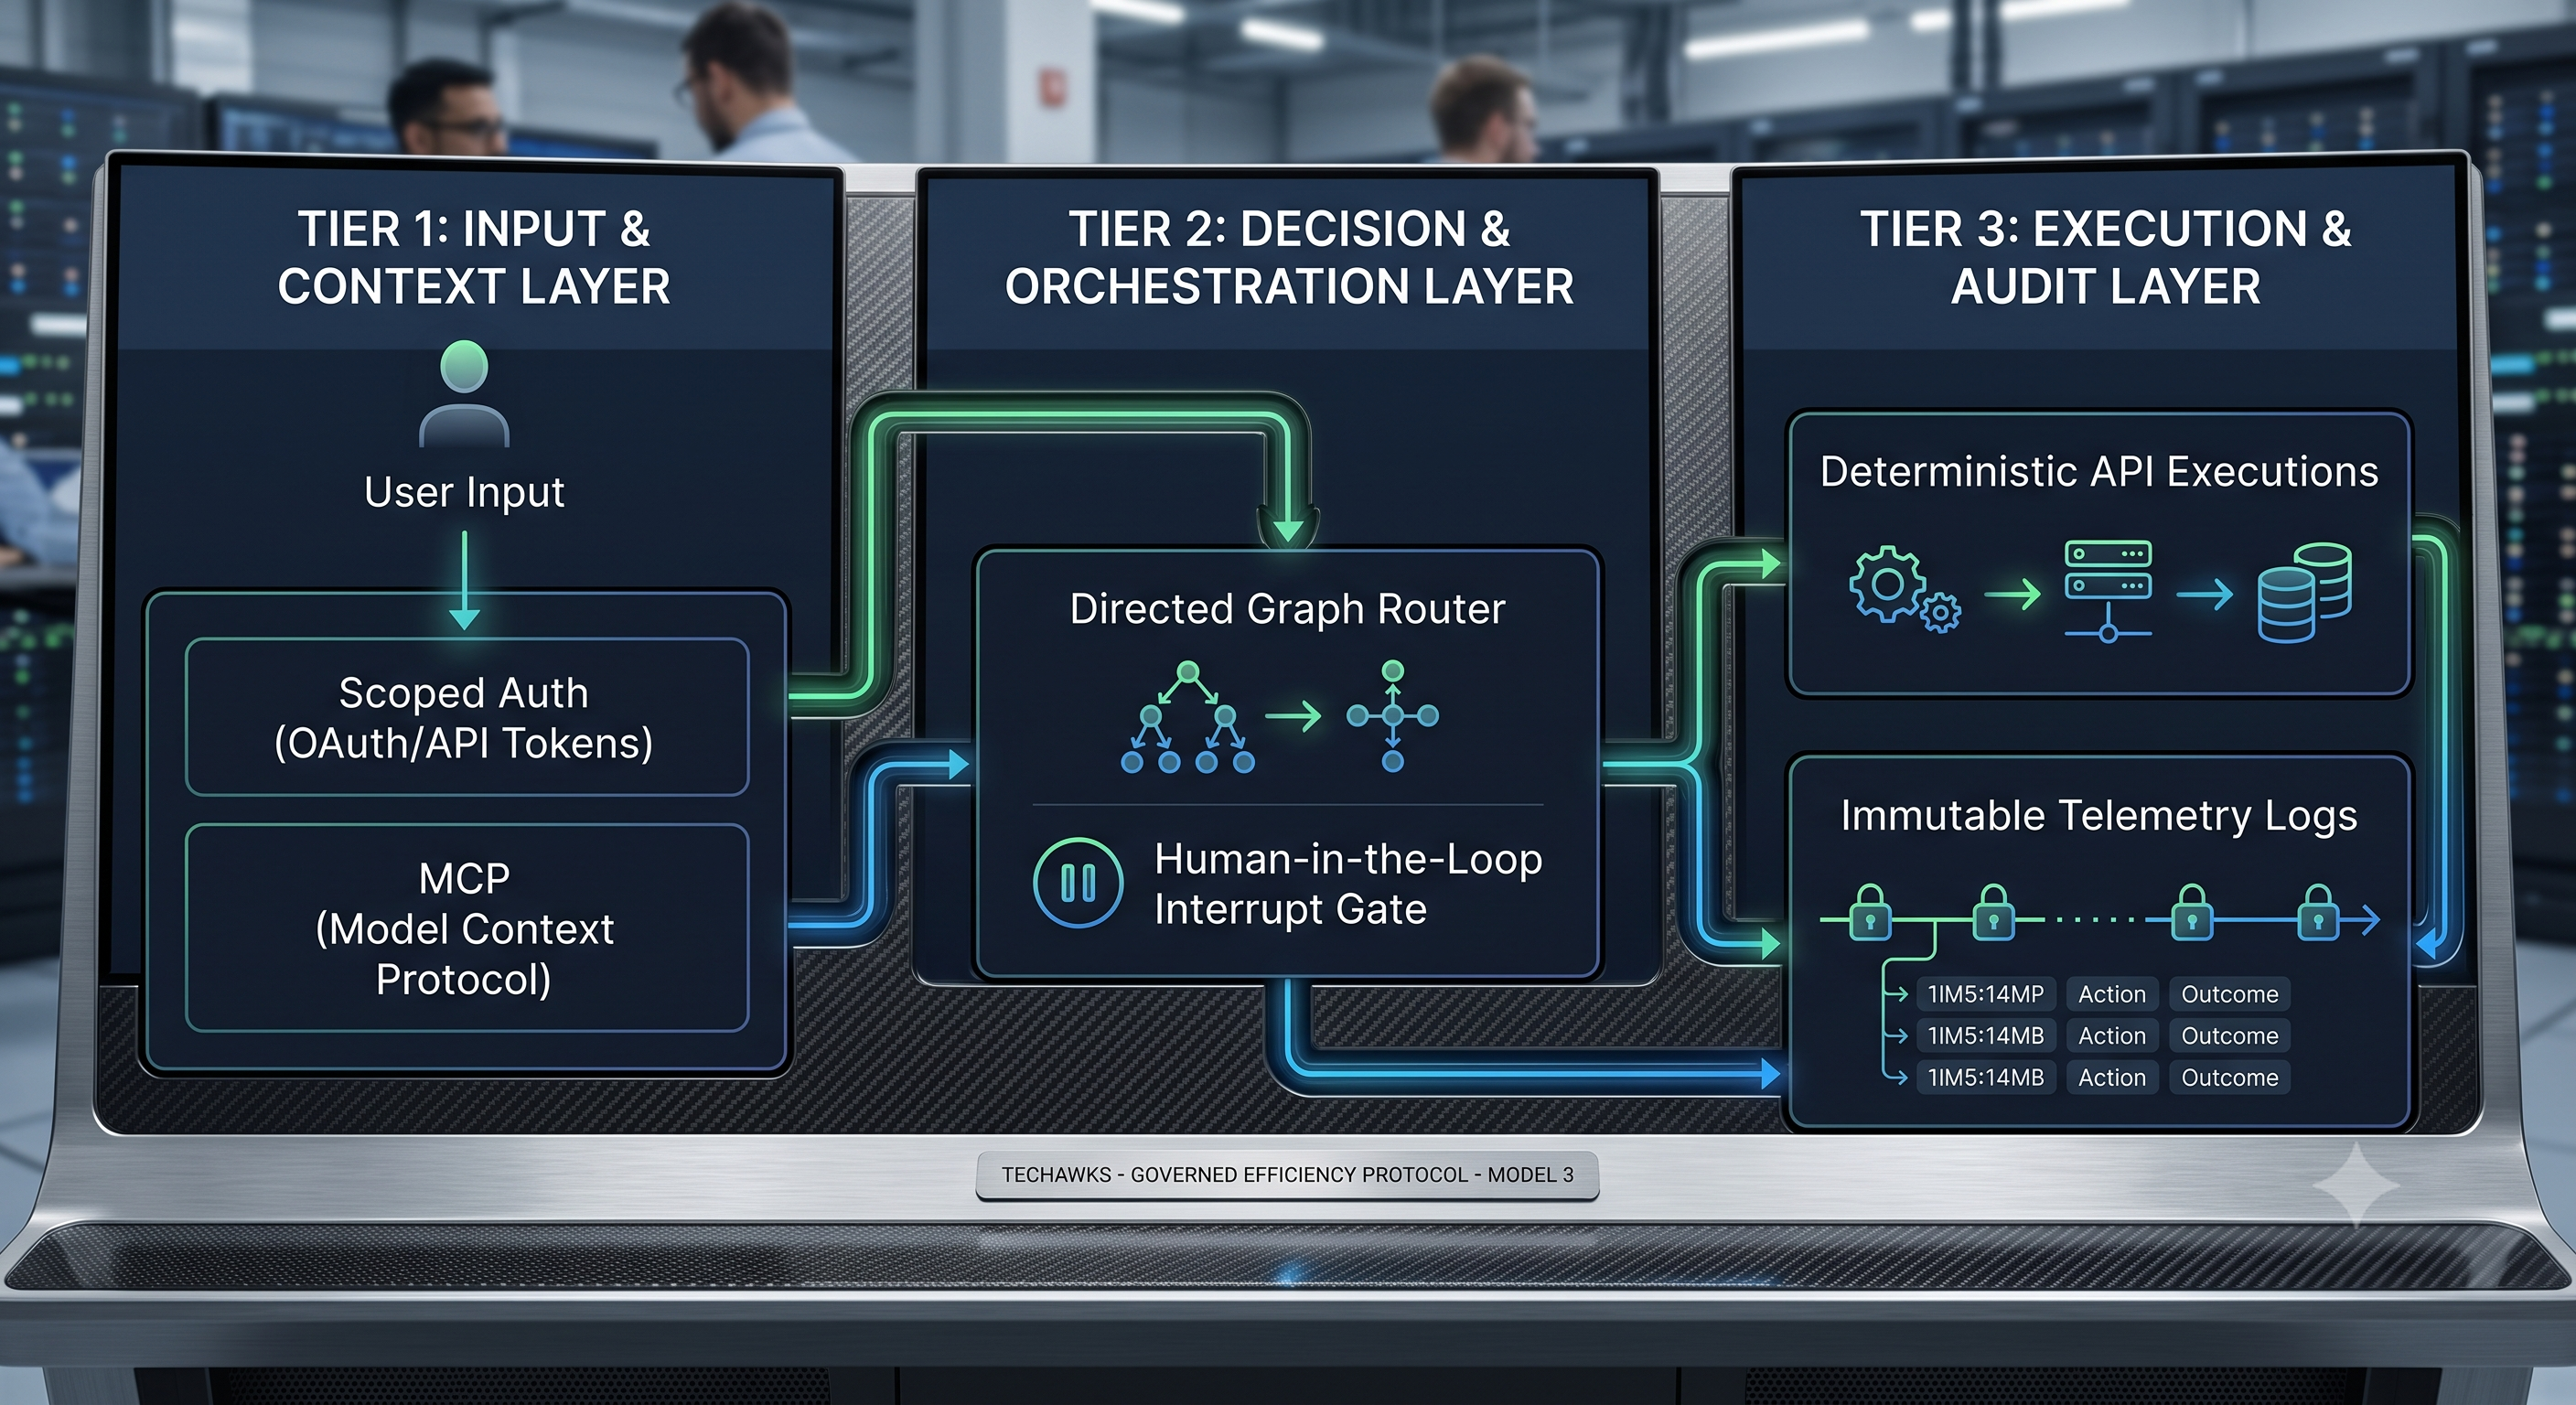 0 Commentarios 0 Acciones 198 Views 0 Vista previa
 -
The 80% SaaS Margin Is Dead: How to Price AI Products for Real Unit Economics
For fifteen years, the venture model was built on a foundational truth: software has near-zero marginal cost per user. You built once, sold infinitely, and printed 75% to 85% gross margins.
In the current landscape, that assumption is broken.
Recent SaaS and AI funding data reveals a massive divergence: traditional B2B SaaS still holds an 80% median gross margin, while AI-native products are struggling at a median of 50% to 53%. Every time an end-user triggers an autonomous agent, runs a RAG pipeline, or generates complex workflows, an inference tax hits your Cost of Goods Sold (COGS).
If you scale your user base on a flat subscription model without accounting for token consumption, more usage means faster cash burn.
Here is the operational framework top AI founders use to protect gross margins before their Series A:
Shift to Outcome-Based or Hybrid Credits: Kill pure unlimited per-seat pricing. Move to a base platform fee combined with consumption-metered credits tied directly to the unit of value delivered (e.g., verified tasks resolved, documents parsed, or workflows completed).
Implement Model Cascading (The 80/20 Compute Split): Never route every customer prompt to frontier reasoning models. Use lightweight, distilled models for extraction, validation, and classification (costing pennies per million tokens), and reserve heavy reasoning models only when an execution branch fails or demands deep logic.
Incorporate Semantic Caching as a Financial Layer: High-performing AI startups treat semantic caching not just as a latency booster, but as a direct margin shield. Caching common prompt intents and intermediate tool outputs cuts repetitive upstream API calls by up to 30%.
Investors are no longer buying top-line ARR that leaks compute costs underneath. If your gross margins don't clear 65%, you don't have a software business—you have a resold compute consultancy.
Discussion Question
POLL: What is currently the biggest threat to your startup's unit economics?
Runaway LLM inference & API token bills
Flat per-seat pricing that power users exploit
Churn due to unpredictable usage-based billing
Customer acquisition cost (CAC) scaling faster than LTV
Drop your vote below and share how you're structuring your pricing tiers!
CTA
Looking to master startup unit economics, pitch decks, and go-to-market strategies with experienced founders?
👉 Join Startup Founders & Entrepreneurs [link in bio/comments] to trade real financial models, investor teardowns, and growth tactics.The 80% SaaS Margin Is Dead: How to Price AI Products for Real Unit Economics For fifteen years, the venture model was built on a foundational truth: software has near-zero marginal cost per user. You built once, sold infinitely, and printed 75% to 85% gross margins. In the current landscape, that assumption is broken. Recent SaaS and AI funding data reveals a massive divergence: traditional B2B SaaS still holds an 80% median gross margin, while AI-native products are struggling at a median of 50% to 53%. Every time an end-user triggers an autonomous agent, runs a RAG pipeline, or generates complex workflows, an inference tax hits your Cost of Goods Sold (COGS). If you scale your user base on a flat subscription model without accounting for token consumption, more usage means faster cash burn. Here is the operational framework top AI founders use to protect gross margins before their Series A: Shift to Outcome-Based or Hybrid Credits: Kill pure unlimited per-seat pricing. Move to a base platform fee combined with consumption-metered credits tied directly to the unit of value delivered (e.g., verified tasks resolved, documents parsed, or workflows completed). Implement Model Cascading (The 80/20 Compute Split): Never route every customer prompt to frontier reasoning models. Use lightweight, distilled models for extraction, validation, and classification (costing pennies per million tokens), and reserve heavy reasoning models only when an execution branch fails or demands deep logic. Incorporate Semantic Caching as a Financial Layer: High-performing AI startups treat semantic caching not just as a latency booster, but as a direct margin shield. Caching common prompt intents and intermediate tool outputs cuts repetitive upstream API calls by up to 30%. Investors are no longer buying top-line ARR that leaks compute costs underneath. If your gross margins don't clear 65%, you don't have a software business—you have a resold compute consultancy. Discussion Question POLL: What is currently the biggest threat to your startup's unit economics? Runaway LLM inference & API token bills Flat per-seat pricing that power users exploit Churn due to unpredictable usage-based billing Customer acquisition cost (CAC) scaling faster than LTV Drop your vote below and share how you're structuring your pricing tiers! CTA Looking to master startup unit economics, pitch decks, and go-to-market strategies with experienced founders? 👉 Join Startup Founders & Entrepreneurs [link in bio/comments] to trade real financial models, investor teardowns, and growth tactics. 0 Commentarios 0 Acciones 217 Views 0 Vista previa
 -
The End of "Per-Seat" SaaS: Why Founders Must Pivot to Work-Completed Pricing in 2026
Venture capital and enterprise procurement in 2026 are telling an unmistakable story: while AI startup deal volume crossed $267 billion in the first half of the year, capital is clustering exclusively around provable operational ROI.
The classic per-seat SaaS model has reached an existential conflict: autonomous agents are designed to reduce human headcount, but seat-based pricing requires expanding human headcount to grow revenue.
When your customer deploys an agentic workflow that reduces a 10-person compliance or triage team down to 2 supervisors, an annual contract based on seats implodes by 80%.
Founders building the next wave of enduring software are abandoning per-seat licensing in favor of outcome-driven and consumption-governed pricing.
How Founders Should Structure Their Business Model
To survive enterprise vendor consolidations and build defensible margins, shift your product architecture and monetization strategy across three fundamental levers:
Monetize the Work Unit, Not the Login
Base your contract tiers on measurable business tasks completed—such as verified invoices reconciled, customer claims resolved autonomously, or pull requests merged. This aligns your upside with customer efficiency: when your software does more work, your average revenue per account (ARPU) scales even as user count shrinks.
Establish Fixed Platform Minimums with Elastic Compute Margins
Outcome pricing without floor limits exposes your startup to volatile token and compute costs. Structure pricing with a mandatory platform fee (covering integration, data governance, and audit tooling) plus an elastic unit price pegged to successful transactions with built-in gross margin protections (>70%).
Sell "Explainability & Control," Not Novelty
Enterprise buyers are no longer impressed by chat interfaces or demo-day automation. Enterprise deals now hinge on governance, compliance audit trails, and human-in-the-loop sign-offs. Make administrative guardrails and determinism your core enterprise upselling tier.
The takeaway: Don't build tools that help humans work slightly faster. Build platforms that take full accountability for business workflows—and price the work, not the human sitting at the desk.
Discussion Question
Founders and operators: Have you transitioned your pricing model away from per-seat subscriptions yet? What has been your biggest hurdle in convincing B2B buyers—measuring outcome metrics or pricing predictability?
CTA
Looking to scale your tech venture, refine your business model, and exchange growth playbooks with battle-tested entrepreneurs?
👉 Join the Startup Founders & Entrepreneurs Community at Techawks to connect with founders, angel investors, and venture operators worldwide.The End of "Per-Seat" SaaS: Why Founders Must Pivot to Work-Completed Pricing in 2026 Venture capital and enterprise procurement in 2026 are telling an unmistakable story: while AI startup deal volume crossed $267 billion in the first half of the year, capital is clustering exclusively around provable operational ROI. The classic per-seat SaaS model has reached an existential conflict: autonomous agents are designed to reduce human headcount, but seat-based pricing requires expanding human headcount to grow revenue. When your customer deploys an agentic workflow that reduces a 10-person compliance or triage team down to 2 supervisors, an annual contract based on seats implodes by 80%. Founders building the next wave of enduring software are abandoning per-seat licensing in favor of outcome-driven and consumption-governed pricing. How Founders Should Structure Their Business Model To survive enterprise vendor consolidations and build defensible margins, shift your product architecture and monetization strategy across three fundamental levers: Monetize the Work Unit, Not the Login Base your contract tiers on measurable business tasks completed—such as verified invoices reconciled, customer claims resolved autonomously, or pull requests merged. This aligns your upside with customer efficiency: when your software does more work, your average revenue per account (ARPU) scales even as user count shrinks. Establish Fixed Platform Minimums with Elastic Compute Margins Outcome pricing without floor limits exposes your startup to volatile token and compute costs. Structure pricing with a mandatory platform fee (covering integration, data governance, and audit tooling) plus an elastic unit price pegged to successful transactions with built-in gross margin protections (>70%). Sell "Explainability & Control," Not Novelty Enterprise buyers are no longer impressed by chat interfaces or demo-day automation. Enterprise deals now hinge on governance, compliance audit trails, and human-in-the-loop sign-offs. Make administrative guardrails and determinism your core enterprise upselling tier. The takeaway: Don't build tools that help humans work slightly faster. Build platforms that take full accountability for business workflows—and price the work, not the human sitting at the desk. Discussion Question Founders and operators: Have you transitioned your pricing model away from per-seat subscriptions yet? What has been your biggest hurdle in convincing B2B buyers—measuring outcome metrics or pricing predictability? CTA Looking to scale your tech venture, refine your business model, and exchange growth playbooks with battle-tested entrepreneurs? 👉 Join the Startup Founders & Entrepreneurs Community at Techawks to connect with founders, angel investors, and venture operators worldwide. 0 Commentarios 0 Acciones 201 Views 0 Vista previa
 -
Stop Building for 6 Months: The 7-Day Customer Pre-Sale Challenge
The most common startup failure mode is not a technical crash; it is building something nobody cares enough to pay for. Founders spend six months polishing UI, configuring multi-region cloud infrastructure, and rewriting features based on casual feedback from friends who say, "That sounds cool."
Compliments are free. Commitment costs capital.
If your product solves an urgent, hair-on-fire problem, a prospect will pay for the solution before the software even exists. Stop writing code this week and take the 7-Day Pre-Sale Challenge:
Define the Pain Point in One Sentence
Strip away the feature set. Articulate the exact cost of the problem your prospect faces right now: "Companies lose $12,000 every quarter to untracked SaaS license renewals." If your value proposition cannot be quantified in saved hours or recovered revenue, refine it until it can.
Build a Concierge Workaround
Instead of engineering an automated workflow, offer to execute the outcome manually. If you are building automated invoice reconciliation, do the reconciliation by hand in a spreadsheet for the first three clients. Delivering the outcome manually teaches you the true operational edge cases and proves demand long before you commit engineering hours.
Ask for an Upfront Commitment
Get on five discovery calls with target users. Walk them through the manual solution or a static workflow deck. Close the call with a concrete ask:
Option A: A discounted annual pre-order invoice.
Option B: A signed letter of intent (LOI) with explicit deployment criteria and pricing.
If five qualified prospects refuse to commit cash or sign an LOI for a manual solution, an automated version will not change their minds.
Great founders don't build software to discover customer demand. They confirm acute customer pain first, then build software to scale the delivery.
Key Takeaways
Polite feedback and user sign-ups are false signals; payment and signed commitments are real validation.
Run concierge MVPs manually to discover critical process edge cases before writing automation code.
Quantify your solution in concrete terms of money saved, revenue generated, or operational risk removed.
If a customer won't pay for the manual outcome, they won't pay for the automated product.
CTA
Ready to stop building in the dark and validate scalable business models? Join the Startup Founders & Entrepreneurs community to trade validation playbooks, teardown go-to-market strategies, and scale with fellow operators. Link below.Stop Building for 6 Months: The 7-Day Customer Pre-Sale Challenge The most common startup failure mode is not a technical crash; it is building something nobody cares enough to pay for. Founders spend six months polishing UI, configuring multi-region cloud infrastructure, and rewriting features based on casual feedback from friends who say, "That sounds cool." Compliments are free. Commitment costs capital. If your product solves an urgent, hair-on-fire problem, a prospect will pay for the solution before the software even exists. Stop writing code this week and take the 7-Day Pre-Sale Challenge: Define the Pain Point in One Sentence Strip away the feature set. Articulate the exact cost of the problem your prospect faces right now: "Companies lose $12,000 every quarter to untracked SaaS license renewals." If your value proposition cannot be quantified in saved hours or recovered revenue, refine it until it can. Build a Concierge Workaround Instead of engineering an automated workflow, offer to execute the outcome manually. If you are building automated invoice reconciliation, do the reconciliation by hand in a spreadsheet for the first three clients. Delivering the outcome manually teaches you the true operational edge cases and proves demand long before you commit engineering hours. Ask for an Upfront Commitment Get on five discovery calls with target users. Walk them through the manual solution or a static workflow deck. Close the call with a concrete ask: Option A: A discounted annual pre-order invoice. Option B: A signed letter of intent (LOI) with explicit deployment criteria and pricing. If five qualified prospects refuse to commit cash or sign an LOI for a manual solution, an automated version will not change their minds. Great founders don't build software to discover customer demand. They confirm acute customer pain first, then build software to scale the delivery. Key Takeaways Polite feedback and user sign-ups are false signals; payment and signed commitments are real validation. Run concierge MVPs manually to discover critical process edge cases before writing automation code. Quantify your solution in concrete terms of money saved, revenue generated, or operational risk removed. If a customer won't pay for the manual outcome, they won't pay for the automated product. CTA Ready to stop building in the dark and validate scalable business models? Join the Startup Founders & Entrepreneurs community to trade validation playbooks, teardown go-to-market strategies, and scale with fellow operators. Link below.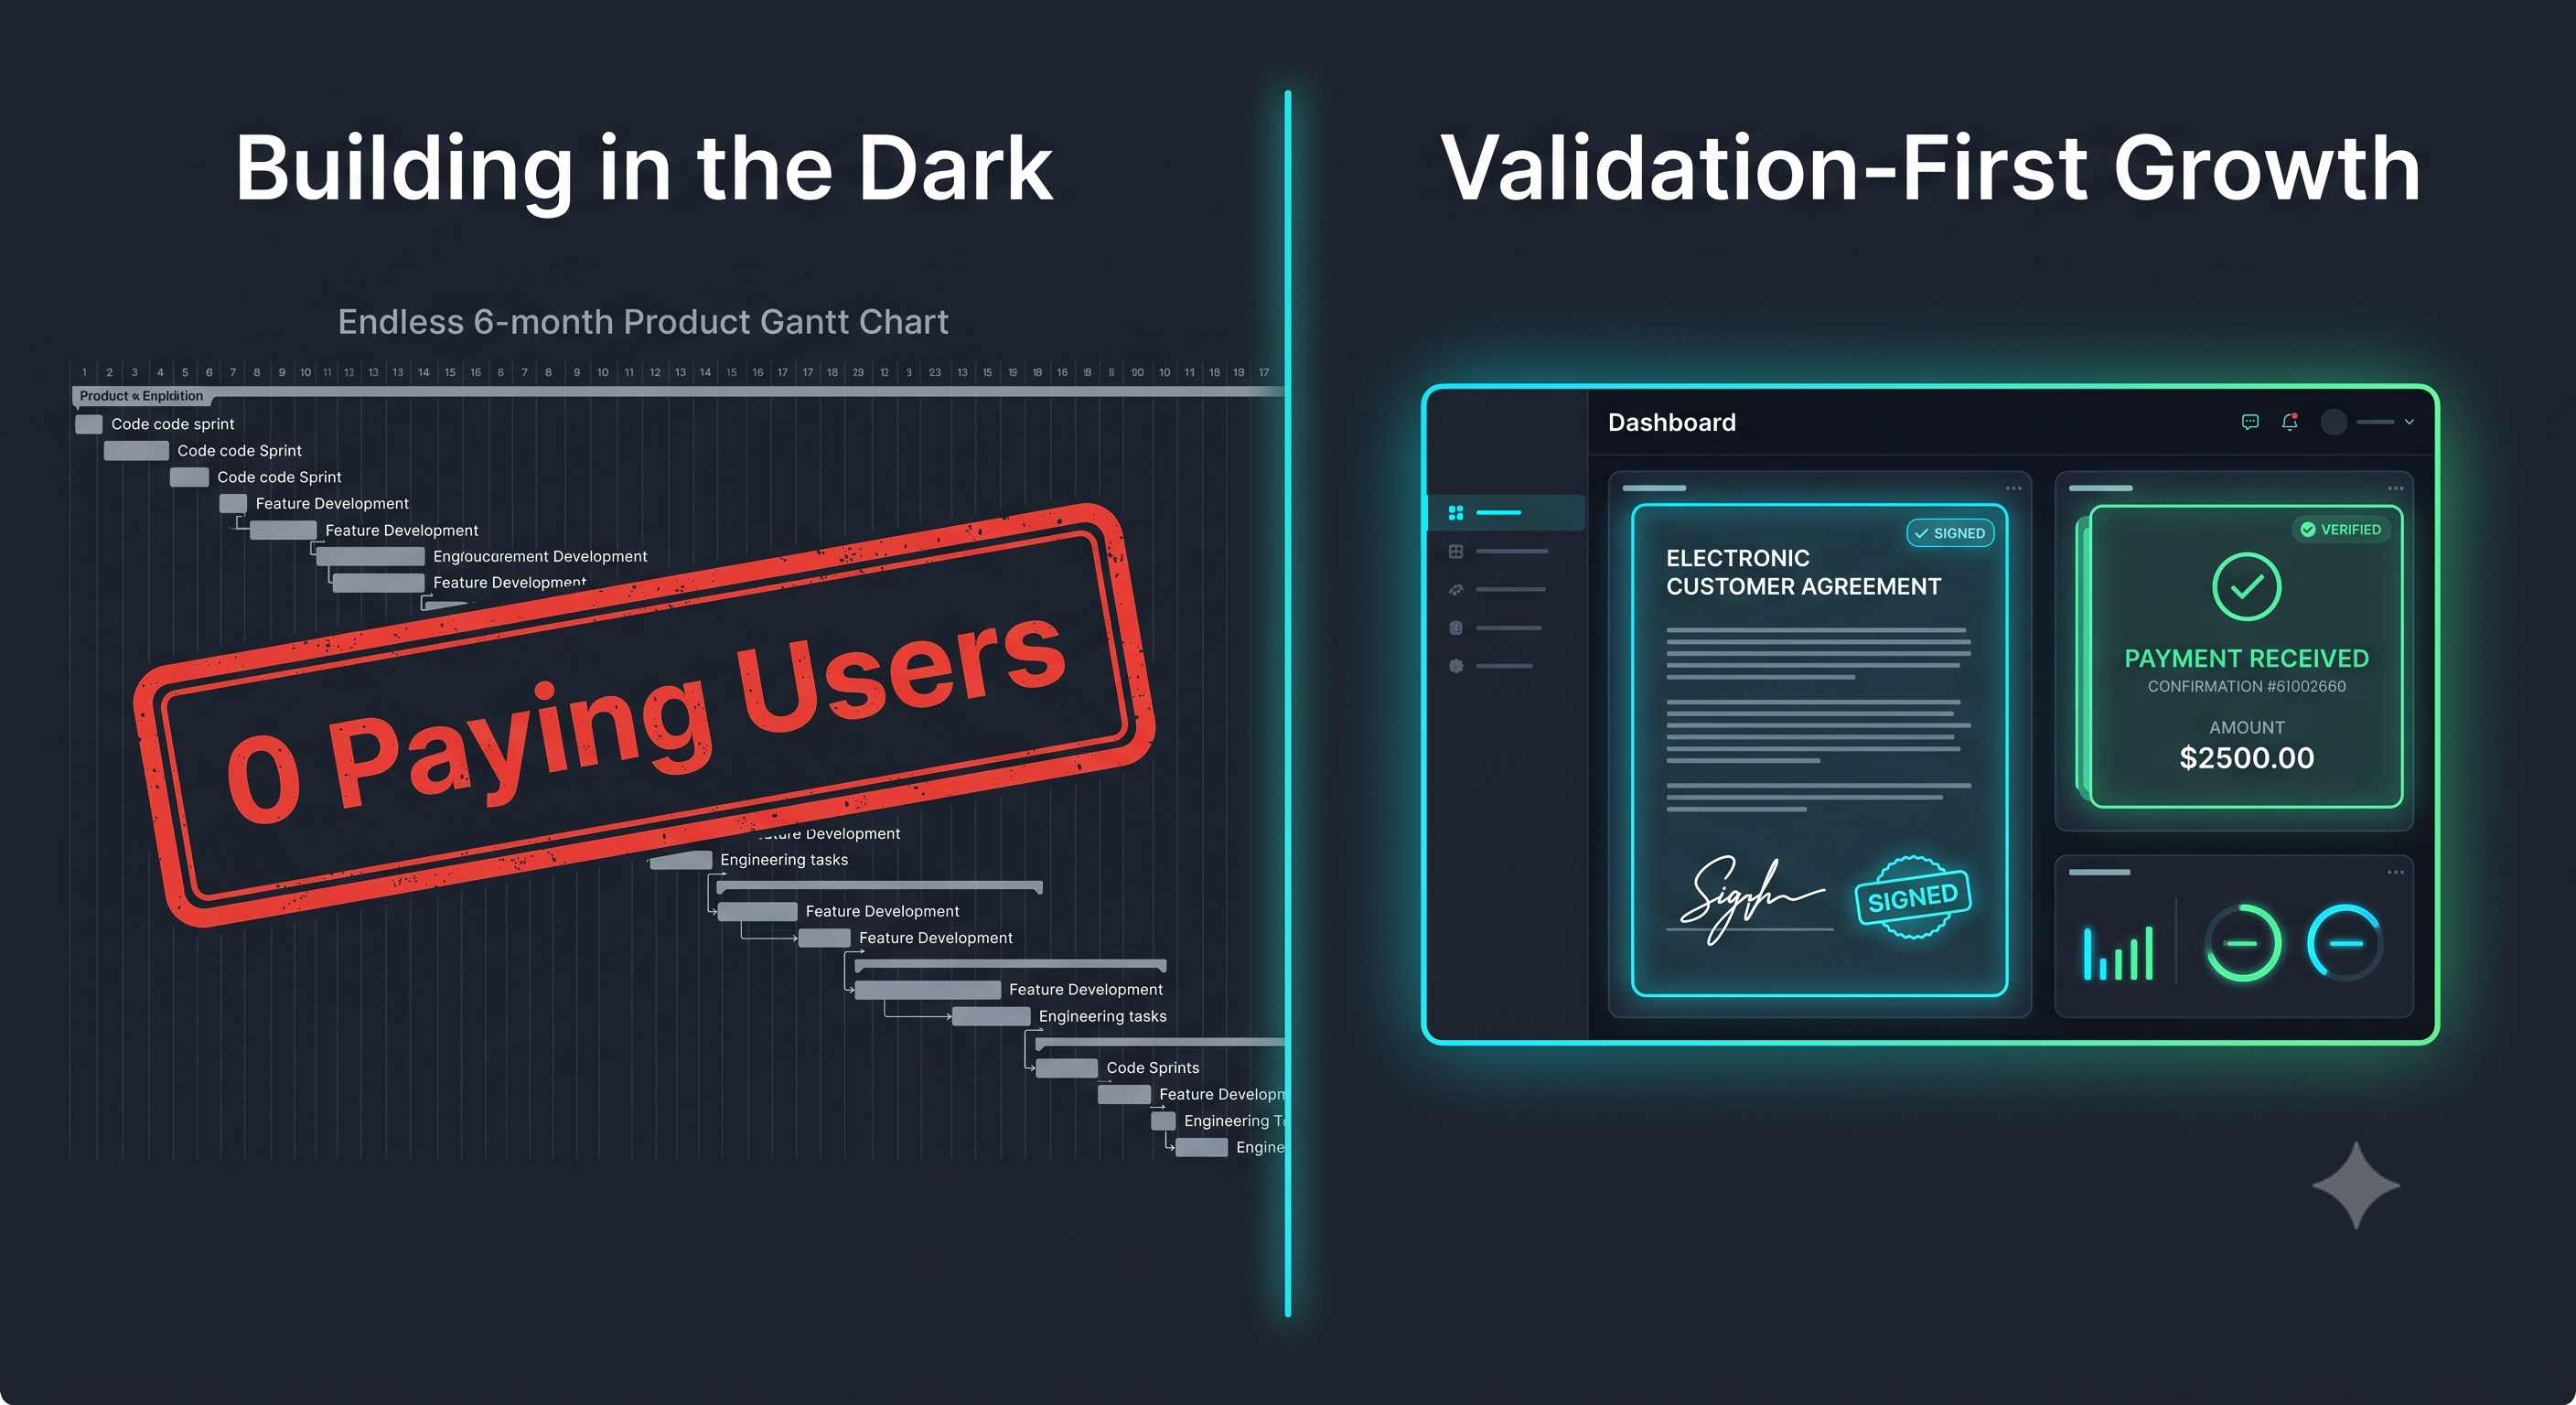 0 Commentarios 0 Acciones 141 Views 0 Vista previa
Quizás te interese…