


Automating Progressive Delivery: Implementing Canary Deployments with Flagger, Argo Rollouts, and Metric Analysis
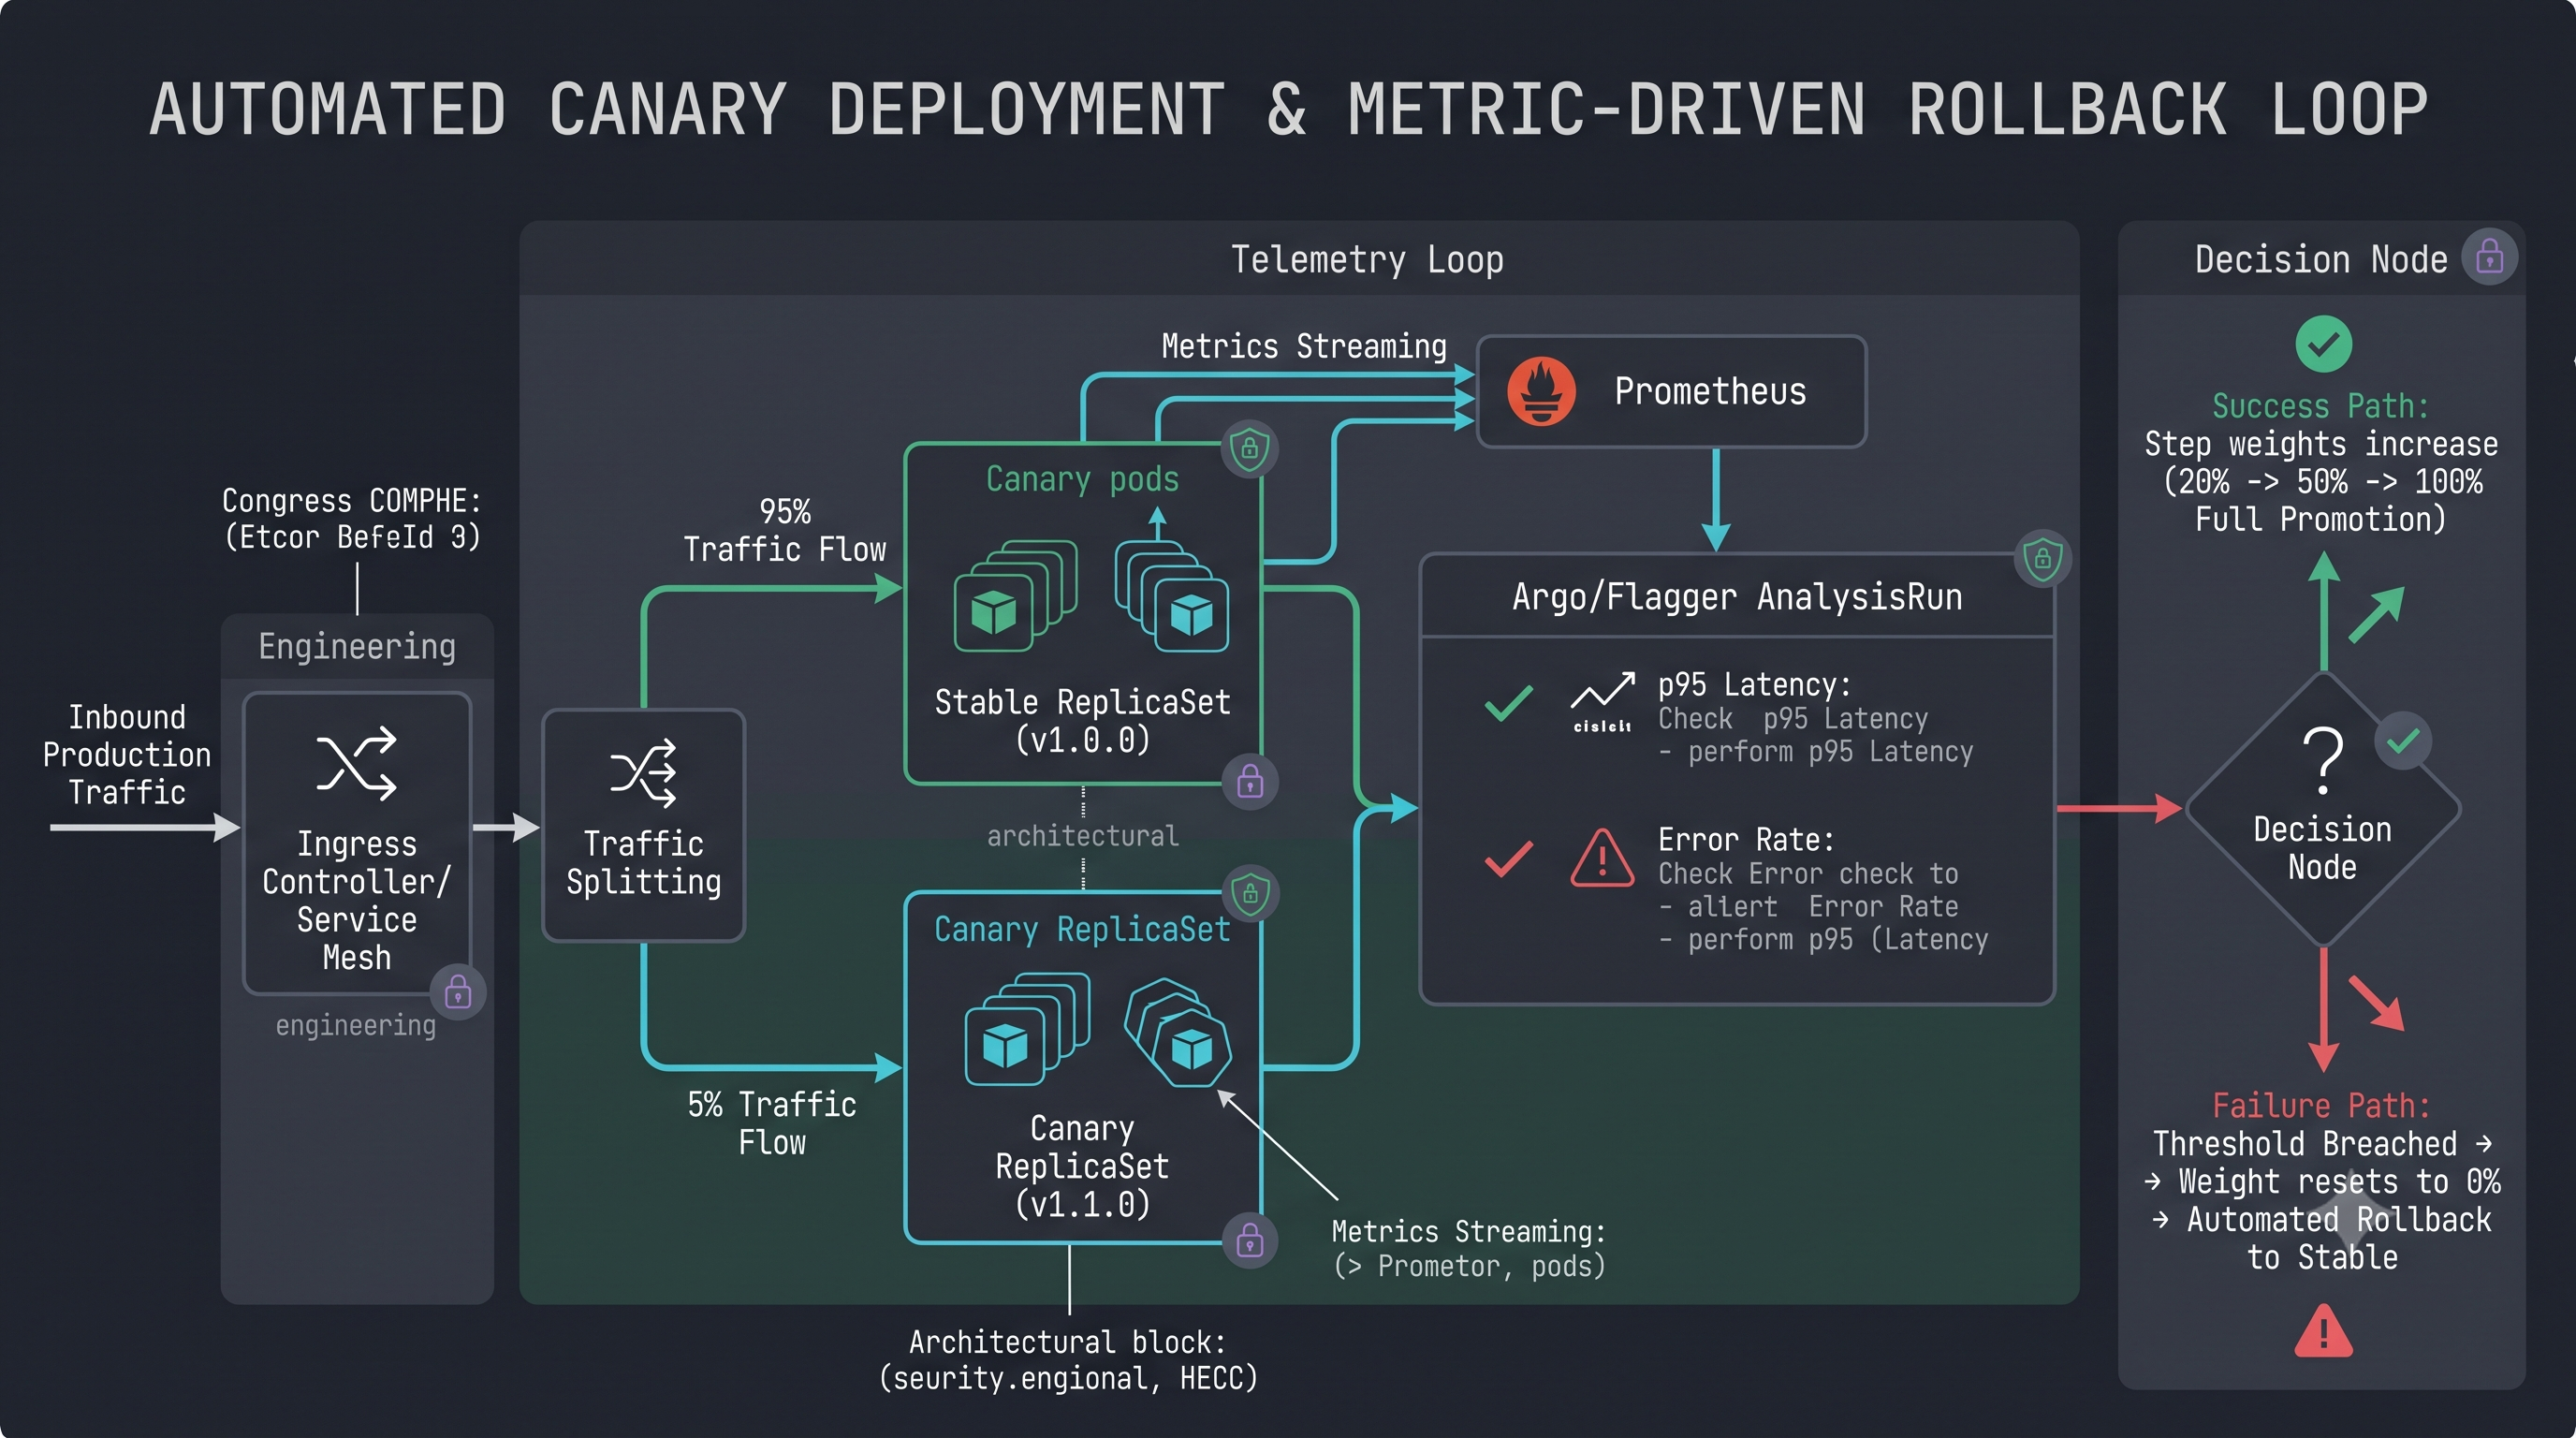
True resilience in continuous delivery isn't just about automated deployment pipelines; it is about automated rollback safety. Progressive delivery replaces binary cutovers with data-driven traffic shaping, incrementally exposing real user traffic to new revisions while actively evaluating Prometheus latency and error-rate percentiles.
Here is a practical, step-by-step tutorial on building an automated Canary deployment pipeline using Kubernetes, Argo Rollouts (or Flagger), and metric-driven analysis.1. Define the Rollout Spec Over Standard Deployments A standard Kubernetes Deployment object offers basic rolling updates, but lacks native ingress traffic splitting and automated metric gating.
Replace your workload kind with an Argo Rollout or define a Flagger Canary custom resource definition (CRD).Decouple the deployment into two distinct Service definitions:
Stable Service: Routes live traffic to the verified revision.
Canary Service: Routes traffic exclusively to the candidate pods during the evaluation window.
Connect these services to your Ingress controller or service mesh (Envoy, Istio, Traefik, or NGINX) to enable fine-grained weight adjustments.2. Configure Incremental Traffic StepsAvoid jumping straight to 50% traffic. Design progressive step intervals with mandatory soak periods:YAMLspec:
strategy:
canary:
canaryService: payment-svc-canary
stableService: payment-svc-stable
trafficRouting:
nginx:
stableIngress: payment-ingress
steps:
- setWeight: 5
- pause: { duration: 5m }
- setWeight: 20
- pause: { duration: 10m }
- setWeight: 50
- pause: { duration: 10m }
Step 1 (5% Weight): Validates baseline boot health, certificate bindings, and edge-case routing without exposing the majority of users.
Pause Intervals: Ensure adequate time for your telemetry stack to accumulate statistically significant metric samples before escalating.3. Establish Production Metric Templates (AnalysisRuns)Never rely on human observation or simple HTTP 200 checks to validate a release. Attach automated metric queries directly to each step:
HTTP Error Rate Threshold (p99):Query Prometheus to assert that the canary error rate remains under 0.5%:Code snippetsum(rate(http_requests_total{status=~"5.*", app="payment-svc-canary"}[2m]))
/
sum(rate(http_requests_total{app="payment-svc-canary"}[2m])) * 100 < 0.5
Latency Budget (p95):Assert that upstream response time does not regress compared to the stable baseline:
Code snippethistogram_quantile(0.95, sum(rate(http_request_duration_seconds_bucket{app="payment-svc-canary"}[2m])) by (le)) < 0.250
Configure consecutive failure limits (e.g., failureLimit: 2). If two back-to-back analysis checks breach the threshold, the controller halts progression immediately.4. Deterministic Automated Rollbacks
The defining power of progressive delivery is the automated abort sequence:
The moment an AnalysisRun registers consecutive metric failures, the controller resets the Ingress weight to 0% on the canary service within milliseconds.
All incoming production traffic instantly flows 100% through the untouched, proven stable pods.
The failed candidate pods are kept alive in an isolated state for 15 minutes to allow engineering teams to scrape heap dumps, inspect logs, and capture profiling data before pod eviction.
Key Takeaways
Shrink the Blast Radius: Step-based traffic ramping (5% $\rightarrow$ 20% $\rightarrow$ 50%) guarantees that infrastructure failures impact only a tiny fraction of users.
Telemetry as the Gatekeeper: Use Prometheus metrics (p95 latency and 5xx error percentages) rather than manual gut-checks to promote builds.
Decouple Stable and Canary: Maintain separate stable and candidate services behind an ingress router capable of weight-based traffic shifting.
Instant Reversion with Post-Mortem Capture: Abort failed weights in milliseconds, but hold candidate pods temporarily to extract runtime debug artifacts.
CTA
How does your team handle continuous deployment safety in production today?Are you running automated canary rollouts via Argo/Flagger, executing manual blue/green cutovers, or relying purely on feature flags like LaunchDarkly or Unleash? Share your deployment strategies, pipeline pain points, and edge-case rollback experiences below.
True resilience in continuous delivery isn't just about automated deployment pipelines; it is about automated rollback safety. Progressive delivery replaces binary cutovers with data-driven traffic shaping, incrementally exposing real user traffic to new revisions while actively evaluating Prometheus latency and error-rate percentiles.
Here is a practical, step-by-step tutorial on building an automated Canary deployment pipeline using Kubernetes, Argo Rollouts (or Flagger), and metric-driven analysis.1. Define the Rollout Spec Over Standard Deployments A standard Kubernetes Deployment object offers basic rolling updates, but lacks native ingress traffic splitting and automated metric gating.
Replace your workload kind with an Argo Rollout or define a Flagger Canary custom resource definition (CRD).Decouple the deployment into two distinct Service definitions:
Stable Service: Routes live traffic to the verified revision.
Canary Service: Routes traffic exclusively to the candidate pods during the evaluation window.
Connect these services to your Ingress controller or service mesh (Envoy, Istio, Traefik, or NGINX) to enable fine-grained weight adjustments.2. Configure Incremental Traffic StepsAvoid jumping straight to 50% traffic. Design progressive step intervals with mandatory soak periods:YAMLspec:
strategy:
canary:
canaryService: payment-svc-canary
stableService: payment-svc-stable
trafficRouting:
nginx:
stableIngress: payment-ingress
steps:
- setWeight: 5
- pause: { duration: 5m }
- setWeight: 20
- pause: { duration: 10m }
- setWeight: 50
- pause: { duration: 10m }
Step 1 (5% Weight): Validates baseline boot health, certificate bindings, and edge-case routing without exposing the majority of users.
Pause Intervals: Ensure adequate time for your telemetry stack to accumulate statistically significant metric samples before escalating.3. Establish Production Metric Templates (AnalysisRuns)Never rely on human observation or simple HTTP 200 checks to validate a release. Attach automated metric queries directly to each step:
HTTP Error Rate Threshold (p99):Query Prometheus to assert that the canary error rate remains under 0.5%:Code snippetsum(rate(http_requests_total{status=~"5.*", app="payment-svc-canary"}[2m]))
/
sum(rate(http_requests_total{app="payment-svc-canary"}[2m])) * 100 < 0.5
Latency Budget (p95):Assert that upstream response time does not regress compared to the stable baseline:
Code snippethistogram_quantile(0.95, sum(rate(http_request_duration_seconds_bucket{app="payment-svc-canary"}[2m])) by (le)) < 0.250
Configure consecutive failure limits (e.g., failureLimit: 2). If two back-to-back analysis checks breach the threshold, the controller halts progression immediately.4. Deterministic Automated Rollbacks
The defining power of progressive delivery is the automated abort sequence:
The moment an AnalysisRun registers consecutive metric failures, the controller resets the Ingress weight to 0% on the canary service within milliseconds.
All incoming production traffic instantly flows 100% through the untouched, proven stable pods.
The failed candidate pods are kept alive in an isolated state for 15 minutes to allow engineering teams to scrape heap dumps, inspect logs, and capture profiling data before pod eviction.
Key Takeaways
Shrink the Blast Radius: Step-based traffic ramping (5% $\rightarrow$ 20% $\rightarrow$ 50%) guarantees that infrastructure failures impact only a tiny fraction of users.
Telemetry as the Gatekeeper: Use Prometheus metrics (p95 latency and 5xx error percentages) rather than manual gut-checks to promote builds.
Decouple Stable and Canary: Maintain separate stable and candidate services behind an ingress router capable of weight-based traffic shifting.
Instant Reversion with Post-Mortem Capture: Abort failed weights in milliseconds, but hold candidate pods temporarily to extract runtime debug artifacts.
CTA
How does your team handle continuous deployment safety in production today?Are you running automated canary rollouts via Argo/Flagger, executing manual blue/green cutovers, or relying purely on feature flags like LaunchDarkly or Unleash? Share your deployment strategies, pipeline pain points, and edge-case rollback experiences below.
Automating Progressive Delivery: Implementing Canary Deployments with Flagger, Argo Rollouts, and Metric Analysis
True resilience in continuous delivery isn't just about automated deployment pipelines; it is about automated rollback safety. Progressive delivery replaces binary cutovers with data-driven traffic shaping, incrementally exposing real user traffic to new revisions while actively evaluating Prometheus latency and error-rate percentiles.
Here is a practical, step-by-step tutorial on building an automated Canary deployment pipeline using Kubernetes, Argo Rollouts (or Flagger), and metric-driven analysis.1. Define the Rollout Spec Over Standard Deployments A standard Kubernetes Deployment object offers basic rolling updates, but lacks native ingress traffic splitting and automated metric gating.
Replace your workload kind with an Argo Rollout or define a Flagger Canary custom resource definition (CRD).Decouple the deployment into two distinct Service definitions:
Stable Service: Routes live traffic to the verified revision.
Canary Service: Routes traffic exclusively to the candidate pods during the evaluation window.
Connect these services to your Ingress controller or service mesh (Envoy, Istio, Traefik, or NGINX) to enable fine-grained weight adjustments.2. Configure Incremental Traffic StepsAvoid jumping straight to 50% traffic. Design progressive step intervals with mandatory soak periods:YAMLspec:
strategy:
canary:
canaryService: payment-svc-canary
stableService: payment-svc-stable
trafficRouting:
nginx:
stableIngress: payment-ingress
steps:
- setWeight: 5
- pause: { duration: 5m }
- setWeight: 20
- pause: { duration: 10m }
- setWeight: 50
- pause: { duration: 10m }
Step 1 (5% Weight): Validates baseline boot health, certificate bindings, and edge-case routing without exposing the majority of users.
Pause Intervals: Ensure adequate time for your telemetry stack to accumulate statistically significant metric samples before escalating.3. Establish Production Metric Templates (AnalysisRuns)Never rely on human observation or simple HTTP 200 checks to validate a release. Attach automated metric queries directly to each step:
HTTP Error Rate Threshold (p99):Query Prometheus to assert that the canary error rate remains under 0.5%:Code snippetsum(rate(http_requests_total{status=~"5.*", app="payment-svc-canary"}[2m]))
/
sum(rate(http_requests_total{app="payment-svc-canary"}[2m])) * 100 < 0.5
Latency Budget (p95):Assert that upstream response time does not regress compared to the stable baseline:
Code snippethistogram_quantile(0.95, sum(rate(http_request_duration_seconds_bucket{app="payment-svc-canary"}[2m])) by (le)) < 0.250
Configure consecutive failure limits (e.g., failureLimit: 2). If two back-to-back analysis checks breach the threshold, the controller halts progression immediately.4. Deterministic Automated Rollbacks
The defining power of progressive delivery is the automated abort sequence:
The moment an AnalysisRun registers consecutive metric failures, the controller resets the Ingress weight to 0% on the canary service within milliseconds.
All incoming production traffic instantly flows 100% through the untouched, proven stable pods.
The failed candidate pods are kept alive in an isolated state for 15 minutes to allow engineering teams to scrape heap dumps, inspect logs, and capture profiling data before pod eviction.
Key Takeaways
Shrink the Blast Radius: Step-based traffic ramping (5% $\rightarrow$ 20% $\rightarrow$ 50%) guarantees that infrastructure failures impact only a tiny fraction of users.
Telemetry as the Gatekeeper: Use Prometheus metrics (p95 latency and 5xx error percentages) rather than manual gut-checks to promote builds.
Decouple Stable and Canary: Maintain separate stable and candidate services behind an ingress router capable of weight-based traffic shifting.
Instant Reversion with Post-Mortem Capture: Abort failed weights in milliseconds, but hold candidate pods temporarily to extract runtime debug artifacts.
CTA
How does your team handle continuous deployment safety in production today?Are you running automated canary rollouts via Argo/Flagger, executing manual blue/green cutovers, or relying purely on feature flags like LaunchDarkly or Unleash? Share your deployment strategies, pipeline pain points, and edge-case rollback experiences below.

 English
 Arabic
 French
 Spanish
 Portuguese
 Deutsch
 Turkish
 Dutch
Dutch
 Italiano
 Russian
 Portuguese (Brazil)
 Greek
Greek