


Stop Shipping Without Observability: The 3-Step Telemetry Framework for High-Reliability US Tech Systems
We have all been there: staring at a generic 500 error screen, rushing to check disparate logs, metrics, and traces across multiple dashboards, and wishing you had better visibility into system state. While rapid feature delivery is essential, treating telemetry and monitoring as an afterthought leads to prolonged downtime and inflated incident response times.
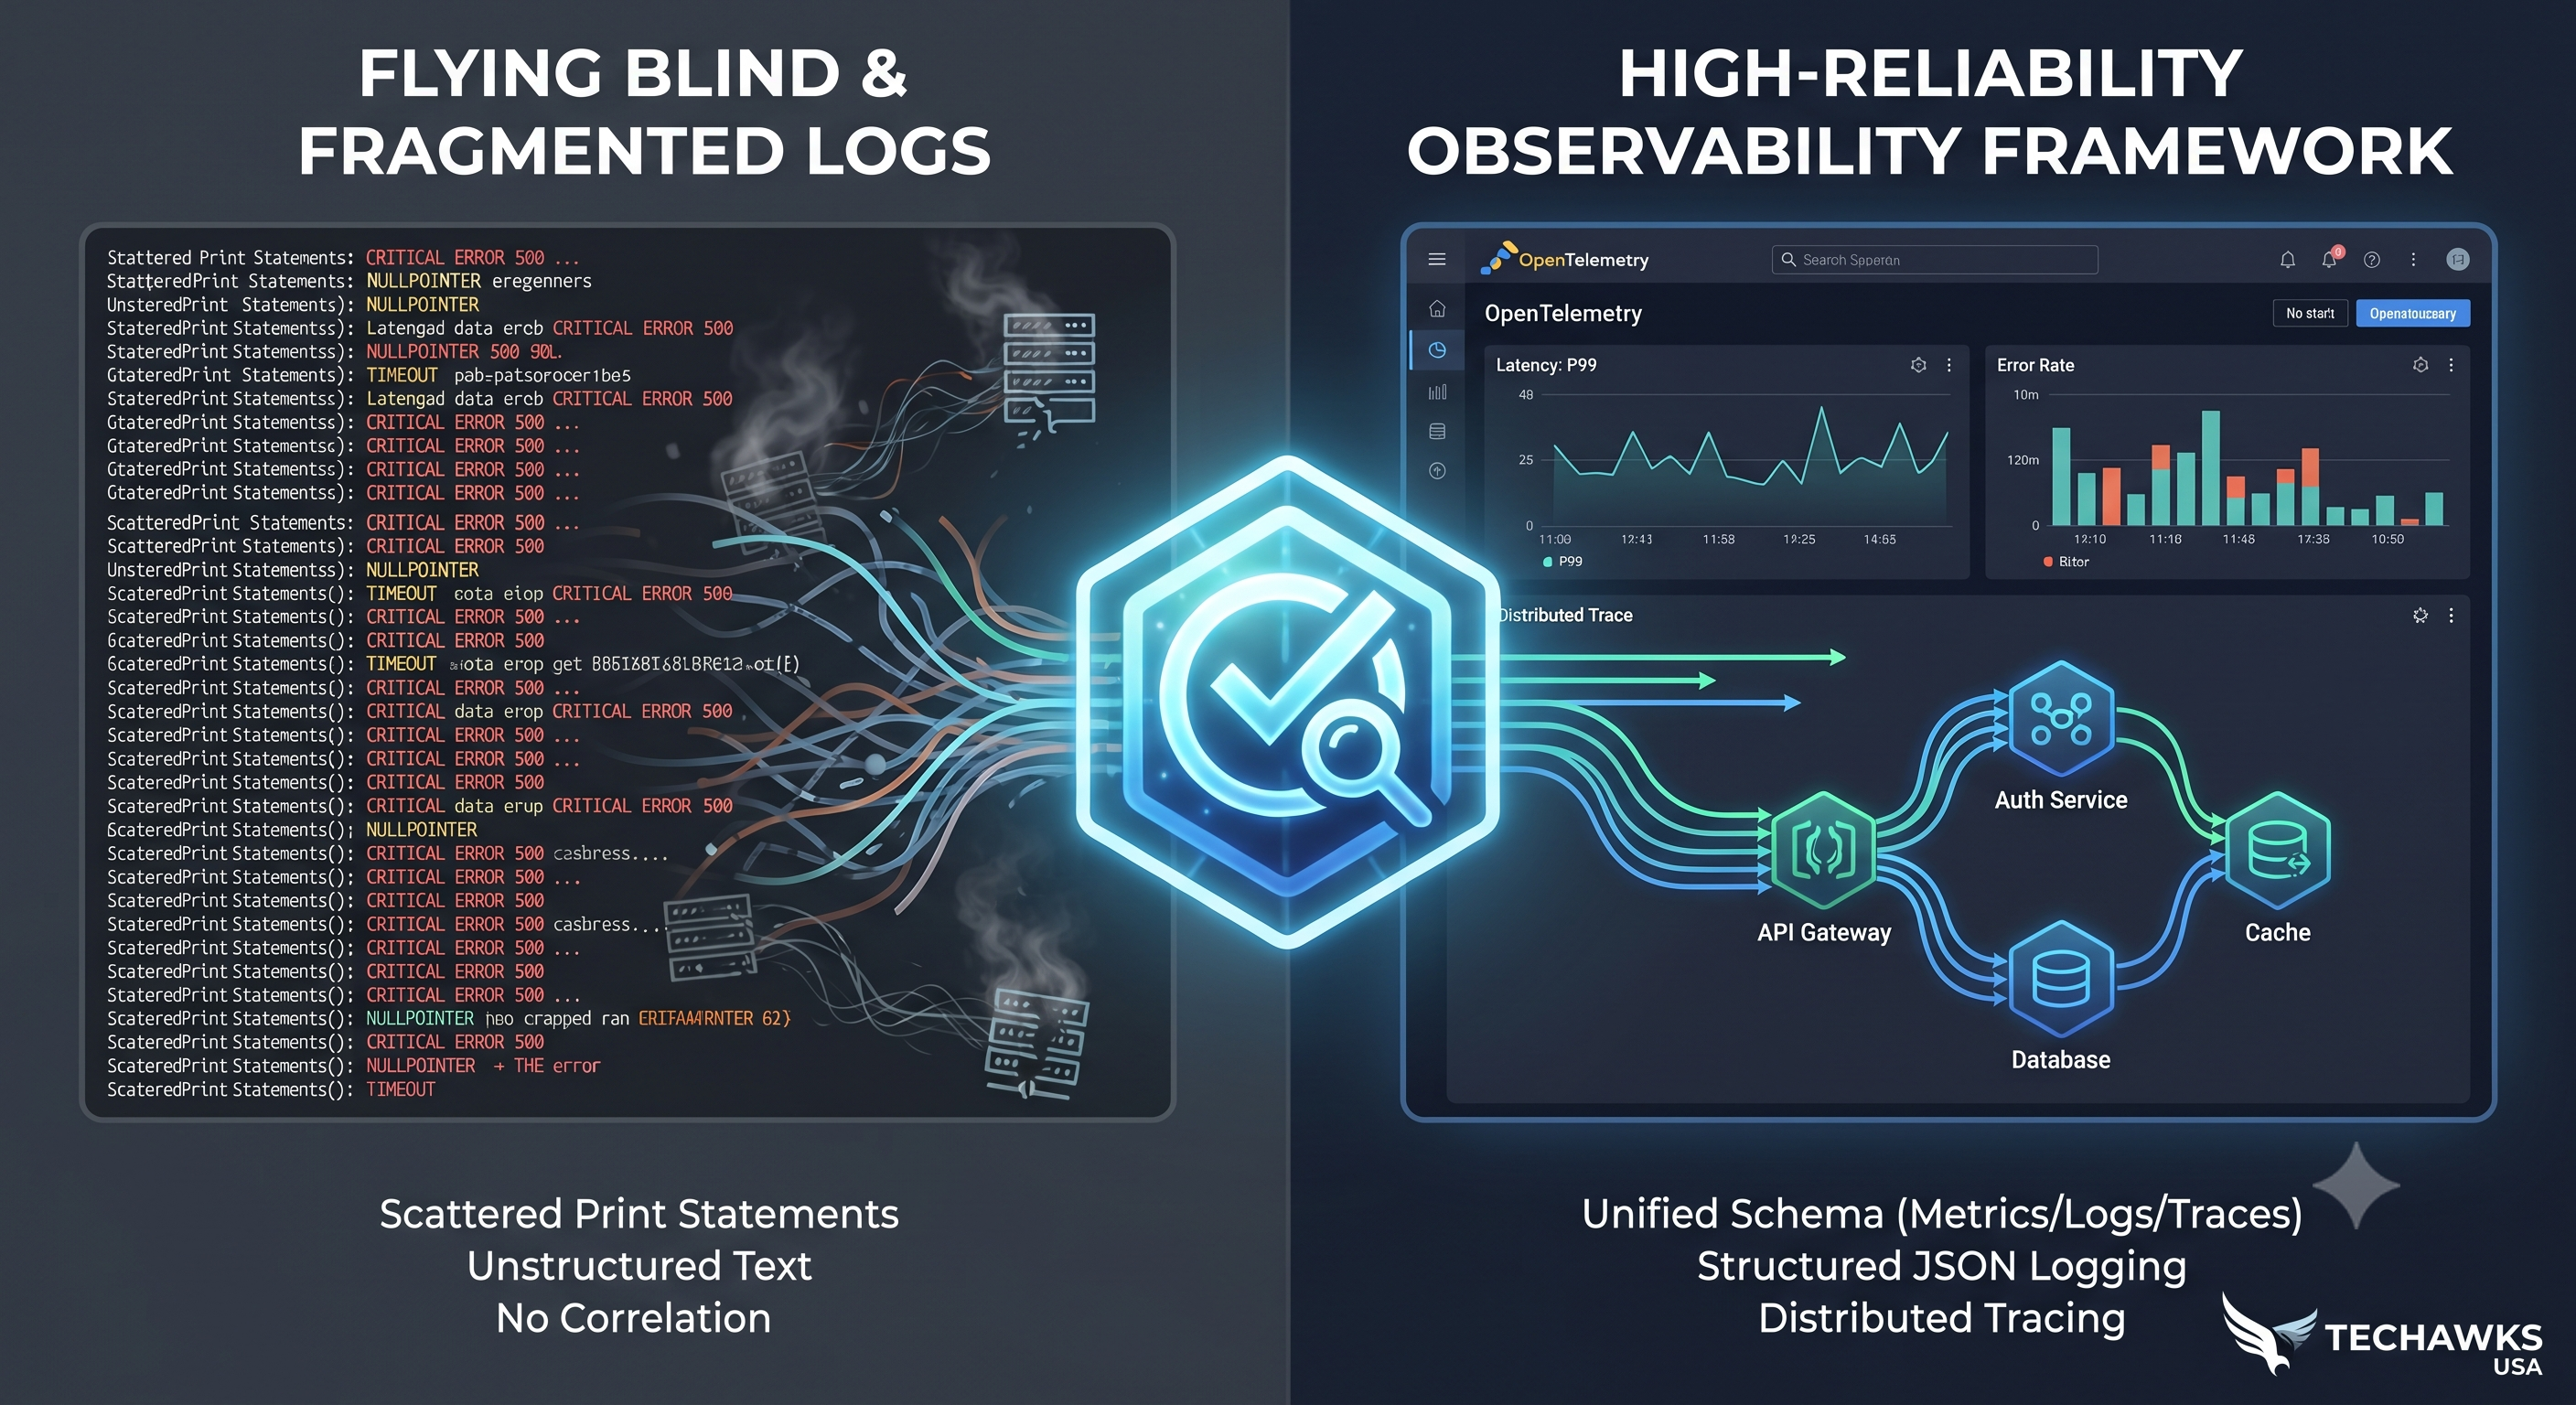
To transform naive logging practices into a robust, high-reliability operational framework suited for modern US tech engineering standards, put every service through this rigorous 3-step challenge framework:
Step 1: The Unified OpenTelemetry Audit
Scattered print statements and custom log formats create noise instead of insight. Before pushing any service live, standardize your instrumentation using OpenTelemetry to collect metrics, logs, and distributed traces under a single unified schema. Ask yourself: Can I trace a single user request seamlessly from the API gateway down to the database layer?
Step 2: The Structured Logging & Context Propagation Check
Unstructured text logs make automated querying and root-cause analysis nearly impossible during high-pressure incidents. Strip out plain-text strings, enforce strict JSON structured logging, and ensure unique correlation IDs and request contexts are propagated across every asynchronous worker and microservice boundary.
Step 3: The Proactive Alerting & Threshold Optimization Pass
Alert fatigue is real; if your team receives dozens of noisy alerts for trivial CPU spikes, they will eventually ignore the ones that actually matter. Strip out vanity metrics, focus your alerting thresholds strictly on customer-facing symptoms (like latency degradation and error rates rather than raw resource usage), and establish clear escalation runbooks.
The Challenge for Today:
Open your core application's recent error logs and trace histories. Pick one critical user transaction path and check if you can track it end-to-end within 60 seconds using your current monitoring tool. If you hit a blind spot, refactor your telemetry before your users experience an unmonitored failure.
Key Takeaways
Unify Your Telemetry: Standardize your metrics, logs, and traces using OpenTelemetry to eliminate fragmented monitoring.
Enforce Structured Logging: Replace plain-text logs with structured JSON and propagate unique correlation IDs across all service boundaries.
Focus Alerts on Impact: Tune alerts away from noisy resource metrics and focus strictly on customer-facing symptoms and actionable thresholds.
CTA (Join Techawks USA)
Want to elevate your system reliability and engineering practices alongside thousands of tech professionals across the United States? Join Techawks USA today to share observability patterns, tackle weekly engineering challenges, and build resilient systems together.
We have all been there: staring at a generic 500 error screen, rushing to check disparate logs, metrics, and traces across multiple dashboards, and wishing you had better visibility into system state. While rapid feature delivery is essential, treating telemetry and monitoring as an afterthought leads to prolonged downtime and inflated incident response times.
To transform naive logging practices into a robust, high-reliability operational framework suited for modern US tech engineering standards, put every service through this rigorous 3-step challenge framework:
Step 1: The Unified OpenTelemetry Audit
Scattered print statements and custom log formats create noise instead of insight. Before pushing any service live, standardize your instrumentation using OpenTelemetry to collect metrics, logs, and distributed traces under a single unified schema. Ask yourself: Can I trace a single user request seamlessly from the API gateway down to the database layer?
Step 2: The Structured Logging & Context Propagation Check
Unstructured text logs make automated querying and root-cause analysis nearly impossible during high-pressure incidents. Strip out plain-text strings, enforce strict JSON structured logging, and ensure unique correlation IDs and request contexts are propagated across every asynchronous worker and microservice boundary.
Step 3: The Proactive Alerting & Threshold Optimization Pass
Alert fatigue is real; if your team receives dozens of noisy alerts for trivial CPU spikes, they will eventually ignore the ones that actually matter. Strip out vanity metrics, focus your alerting thresholds strictly on customer-facing symptoms (like latency degradation and error rates rather than raw resource usage), and establish clear escalation runbooks.
The Challenge for Today:
Open your core application's recent error logs and trace histories. Pick one critical user transaction path and check if you can track it end-to-end within 60 seconds using your current monitoring tool. If you hit a blind spot, refactor your telemetry before your users experience an unmonitored failure.
Key Takeaways
Unify Your Telemetry: Standardize your metrics, logs, and traces using OpenTelemetry to eliminate fragmented monitoring.
Enforce Structured Logging: Replace plain-text logs with structured JSON and propagate unique correlation IDs across all service boundaries.
Focus Alerts on Impact: Tune alerts away from noisy resource metrics and focus strictly on customer-facing symptoms and actionable thresholds.
CTA (Join Techawks USA)
Want to elevate your system reliability and engineering practices alongside thousands of tech professionals across the United States? Join Techawks USA today to share observability patterns, tackle weekly engineering challenges, and build resilient systems together.
Stop Shipping Without Observability: The 3-Step Telemetry Framework for High-Reliability US Tech Systems
We have all been there: staring at a generic 500 error screen, rushing to check disparate logs, metrics, and traces across multiple dashboards, and wishing you had better visibility into system state. While rapid feature delivery is essential, treating telemetry and monitoring as an afterthought leads to prolonged downtime and inflated incident response times.
To transform naive logging practices into a robust, high-reliability operational framework suited for modern US tech engineering standards, put every service through this rigorous 3-step challenge framework:
Step 1: The Unified OpenTelemetry Audit
Scattered print statements and custom log formats create noise instead of insight. Before pushing any service live, standardize your instrumentation using OpenTelemetry to collect metrics, logs, and distributed traces under a single unified schema. Ask yourself: Can I trace a single user request seamlessly from the API gateway down to the database layer?
Step 2: The Structured Logging & Context Propagation Check
Unstructured text logs make automated querying and root-cause analysis nearly impossible during high-pressure incidents. Strip out plain-text strings, enforce strict JSON structured logging, and ensure unique correlation IDs and request contexts are propagated across every asynchronous worker and microservice boundary.
Step 3: The Proactive Alerting & Threshold Optimization Pass
Alert fatigue is real; if your team receives dozens of noisy alerts for trivial CPU spikes, they will eventually ignore the ones that actually matter. Strip out vanity metrics, focus your alerting thresholds strictly on customer-facing symptoms (like latency degradation and error rates rather than raw resource usage), and establish clear escalation runbooks.
The Challenge for Today:
Open your core application's recent error logs and trace histories. Pick one critical user transaction path and check if you can track it end-to-end within 60 seconds using your current monitoring tool. If you hit a blind spot, refactor your telemetry before your users experience an unmonitored failure.
Key Takeaways
Unify Your Telemetry: Standardize your metrics, logs, and traces using OpenTelemetry to eliminate fragmented monitoring.
Enforce Structured Logging: Replace plain-text logs with structured JSON and propagate unique correlation IDs across all service boundaries.
Focus Alerts on Impact: Tune alerts away from noisy resource metrics and focus strictly on customer-facing symptoms and actionable thresholds.
CTA (Join Techawks USA)
Want to elevate your system reliability and engineering practices alongside thousands of tech professionals across the United States? Join Techawks USA today to share observability patterns, tackle weekly engineering challenges, and build resilient systems together.

 English
 Arabic
 French
 Spanish
 Portuguese
 Deutsch
 Turkish
 Dutch
Dutch
 Italiano
 Romaian
 Portuguese (Brazil)
 Greek
Greek