


Stop Guessing, Start Profiling: Why Chrome DevTools’ Performance Panel is the Ultimate Frontend Debugger
You’ve optimized your React state, purged unused CSS, and compressed every image on the site—so why does your app still feel sluggish on low-tier devices? Most developers debug performance by guessing. Let’s look at how to actually see where your runtime budget is leaking.
When an application drops frames, the knee-jerk reaction is often to blame framework overhead or heavy re-renders. But without hard data, optimization attempts are just shots in the dark.
The Chrome DevTools Performance Panel is arguably the most powerful—and underutilized—tool in a web developer's arsenal for diagnosing runtime bottlenecks. Here is how to run a clean runtime audit in three actionable steps:
1. Eliminate Environment Noise
Profiling on a top-tier developer workstation distorts reality. Before recording:
Open a Clean Incognito Window (prevents browser extensions from skewing execution times).
Go to the Performance Panel settings (gear icon) and set CPU Throttling to 4x or 6x slowdown.
Set Network to Fast 3G to simulate real-world mobile CPU and connection constraints.
2. Record and Locate Main-Thread Blockers
Hit Record, perform the single user interaction that feels slow (e.g., opening a complex modal or filtering a table), and stop the recording immediately. Keep recordings short (3–5 seconds) to avoid data overload.
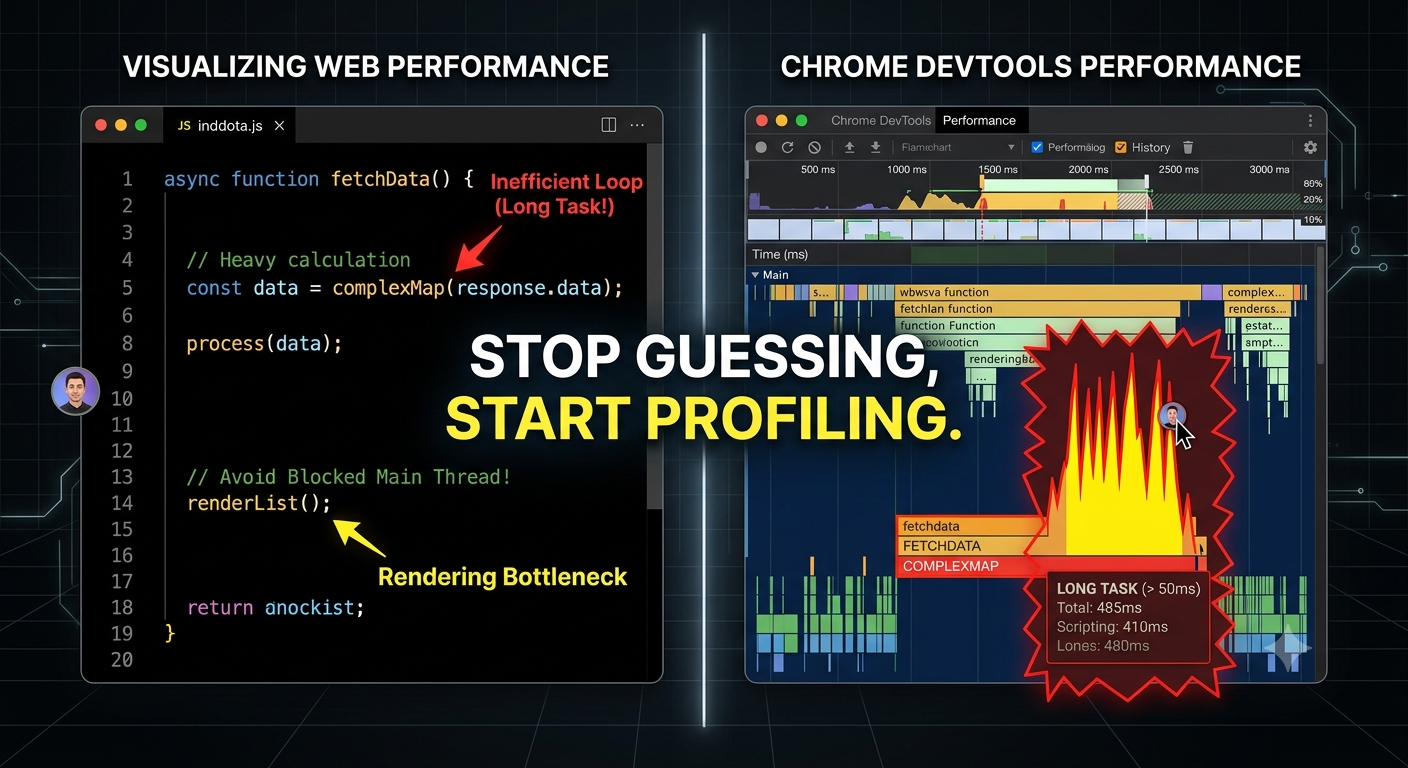
Look directly at the Main flame chart. Long tasks will be flagged with a red corner indicator:
Yellow blocks (Scripting): High JavaScript execution time. Look for deep call stacks indicating recursive functions or un-memoized heavy calculations.
Purple blocks (Rendering): Style recalculations and layout thrashing. Often caused by reading element layout properties (like offsetHeight) right after mutating the DOM in a loop.
Green blocks (Painting): Compositing and paint bottlenecks, usually solved by delegating animations to GPU-accelerated CSS properties (transform, opacity).
3. Trace Call Stacks to Source Code
Click on any long yellow task in the Main thread view, then check the Bottom-Up or Call Tree tab at the bottom panel. Sort by Self Time to see which specific function ate up the CPU cycles, then click the source link to jump straight to the offending line in your code.
Key Takeaways
Profile before refactoring: Never optimize based on intuition; let execution data guide your code changes.
Throttle your environment: CPU throttling reveals real-world micro-stutters you’ll never notice on a high-end dev setup.
Watch for Layout Thrashing: Avoid reading geometry properties immediately after DOM writes within execution loops.
CTA
Want to sharpen your frontend engineering skills alongside a community of active builders? Join Developers & Coding on Techawks today to share techniques, review code, and level up your stack.
You’ve optimized your React state, purged unused CSS, and compressed every image on the site—so why does your app still feel sluggish on low-tier devices? Most developers debug performance by guessing. Let’s look at how to actually see where your runtime budget is leaking.
When an application drops frames, the knee-jerk reaction is often to blame framework overhead or heavy re-renders. But without hard data, optimization attempts are just shots in the dark.
The Chrome DevTools Performance Panel is arguably the most powerful—and underutilized—tool in a web developer's arsenal for diagnosing runtime bottlenecks. Here is how to run a clean runtime audit in three actionable steps:
1. Eliminate Environment Noise
Profiling on a top-tier developer workstation distorts reality. Before recording:
Open a Clean Incognito Window (prevents browser extensions from skewing execution times).
Go to the Performance Panel settings (gear icon) and set CPU Throttling to 4x or 6x slowdown.
Set Network to Fast 3G to simulate real-world mobile CPU and connection constraints.
2. Record and Locate Main-Thread Blockers
Hit Record, perform the single user interaction that feels slow (e.g., opening a complex modal or filtering a table), and stop the recording immediately. Keep recordings short (3–5 seconds) to avoid data overload.
Look directly at the Main flame chart. Long tasks will be flagged with a red corner indicator:
Yellow blocks (Scripting): High JavaScript execution time. Look for deep call stacks indicating recursive functions or un-memoized heavy calculations.
Purple blocks (Rendering): Style recalculations and layout thrashing. Often caused by reading element layout properties (like offsetHeight) right after mutating the DOM in a loop.
Green blocks (Painting): Compositing and paint bottlenecks, usually solved by delegating animations to GPU-accelerated CSS properties (transform, opacity).
3. Trace Call Stacks to Source Code
Click on any long yellow task in the Main thread view, then check the Bottom-Up or Call Tree tab at the bottom panel. Sort by Self Time to see which specific function ate up the CPU cycles, then click the source link to jump straight to the offending line in your code.
Key Takeaways
Profile before refactoring: Never optimize based on intuition; let execution data guide your code changes.
Throttle your environment: CPU throttling reveals real-world micro-stutters you’ll never notice on a high-end dev setup.
Watch for Layout Thrashing: Avoid reading geometry properties immediately after DOM writes within execution loops.
CTA
Want to sharpen your frontend engineering skills alongside a community of active builders? Join Developers & Coding on Techawks today to share techniques, review code, and level up your stack.
Stop Guessing, Start Profiling: Why Chrome DevTools’ Performance Panel is the Ultimate Frontend Debugger
You’ve optimized your React state, purged unused CSS, and compressed every image on the site—so why does your app still feel sluggish on low-tier devices? Most developers debug performance by guessing. Let’s look at how to actually see where your runtime budget is leaking.
When an application drops frames, the knee-jerk reaction is often to blame framework overhead or heavy re-renders. But without hard data, optimization attempts are just shots in the dark.
The Chrome DevTools Performance Panel is arguably the most powerful—and underutilized—tool in a web developer's arsenal for diagnosing runtime bottlenecks. Here is how to run a clean runtime audit in three actionable steps:
1. Eliminate Environment Noise
Profiling on a top-tier developer workstation distorts reality. Before recording:
Open a Clean Incognito Window (prevents browser extensions from skewing execution times).
Go to the Performance Panel settings (gear icon) and set CPU Throttling to 4x or 6x slowdown.
Set Network to Fast 3G to simulate real-world mobile CPU and connection constraints.
2. Record and Locate Main-Thread Blockers
Hit Record, perform the single user interaction that feels slow (e.g., opening a complex modal or filtering a table), and stop the recording immediately. Keep recordings short (3–5 seconds) to avoid data overload.
Look directly at the Main flame chart. Long tasks will be flagged with a red corner indicator:
Yellow blocks (Scripting): High JavaScript execution time. Look for deep call stacks indicating recursive functions or un-memoized heavy calculations.
Purple blocks (Rendering): Style recalculations and layout thrashing. Often caused by reading element layout properties (like offsetHeight) right after mutating the DOM in a loop.
Green blocks (Painting): Compositing and paint bottlenecks, usually solved by delegating animations to GPU-accelerated CSS properties (transform, opacity).
3. Trace Call Stacks to Source Code
Click on any long yellow task in the Main thread view, then check the Bottom-Up or Call Tree tab at the bottom panel. Sort by Self Time to see which specific function ate up the CPU cycles, then click the source link to jump straight to the offending line in your code.
Key Takeaways
Profile before refactoring: Never optimize based on intuition; let execution data guide your code changes.
Throttle your environment: CPU throttling reveals real-world micro-stutters you’ll never notice on a high-end dev setup.
Watch for Layout Thrashing: Avoid reading geometry properties immediately after DOM writes within execution loops.
CTA
Want to sharpen your frontend engineering skills alongside a community of active builders? Join Developers & Coding on Techawks today to share techniques, review code, and level up your stack.

 English
 Arabic
 French
 Spanish
 Portuguese
 Deutsch
 Turkish
 Dutch
Dutch
 Italiano
 Russian
 Portuguese (Brazil)
 Greek
Greek