


Tool Review: Why OpenTelemetry (OTel) Is the Essential Engine for Modern US Cloud Observability
If your platform engineering team is managing multiple third-party agents across Kubernetes clusters or multi-region cloud deployments, OTel should be in your architecture stack.
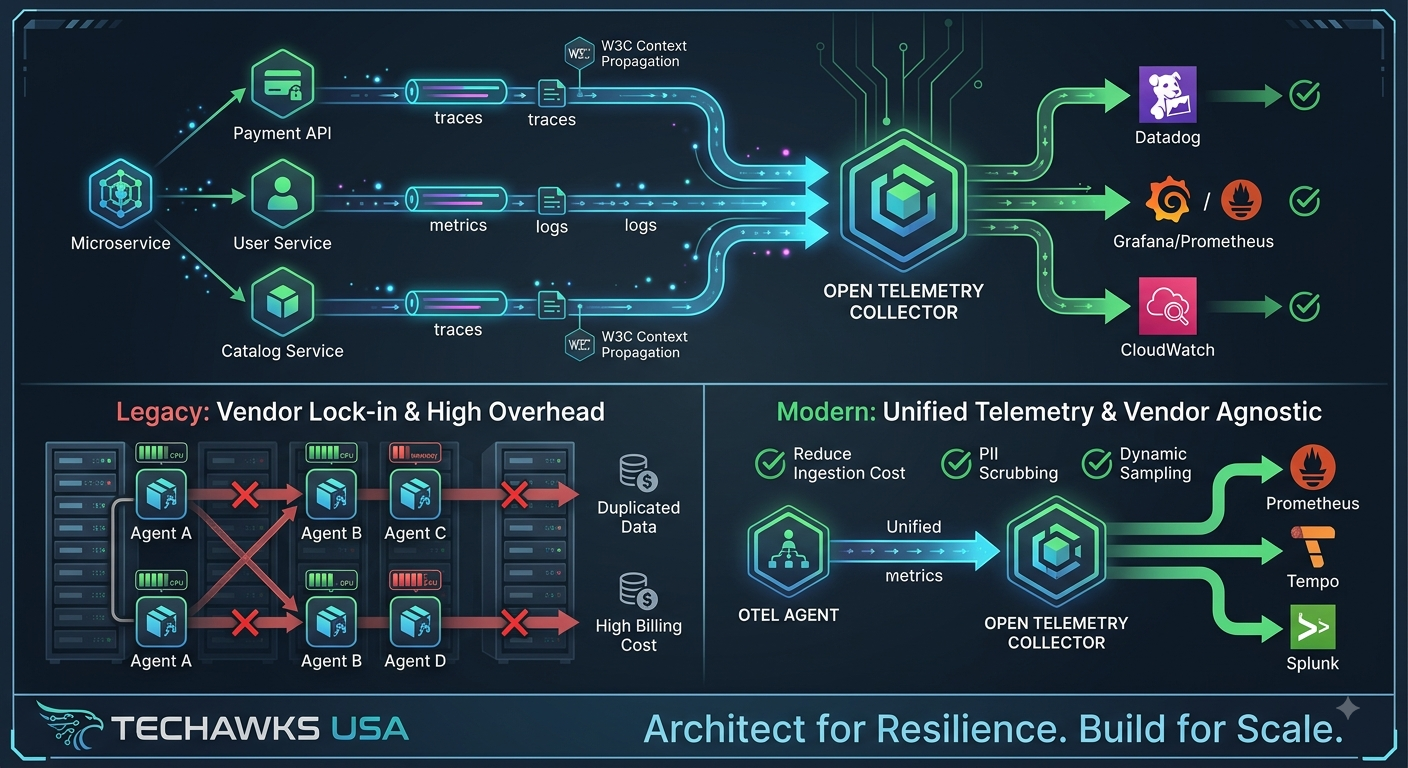
OpenTelemetry provides a single set of APIs, SDKs, and a processing Collector to generate, enrich, and export telemetry data—whether you route it to Datadog, Grafana, Honeycomb, or AWS CloudWatch.
┌────────────────────────────┐
│ Application Services & Apps │
└────────────────────────────┘
│ (Traces, Metrics, Logs)
▼
┌────────────────────────────┐
│ OpenTelemetry Collector │
│ (Local Buffering, Filtering & Enrichment) │
└───────┬─────────────────── ┘
│ │ │
▼ ▼ ▼
┌─────────────┐ ┌─────────────┐ ┌ ─┐
│ Datadog/SaaS│ │ Grafana/Prom│ │ AWS S3 / SQS│
└─────────────┘ └─────────────┘ └ ─┘
Key Strengths for Enterprise Systems
Zero Vendor Lock-in: Decouple data collection from analysis. Swap or add monitoring backends simply by updating your Collector configuration file without changing application code.
Unified Telemetry Stream: Automatically correlate traces, metrics, and logs using W3C Trace Context, allowing engineers to drill down from a p99 latency spike directly to the exact failing line of code.
The OpenTelemetry Collector: Acts as a proxy layer in your cluster to aggregate, scrub sensitive PII, compress, and sample high-volume telemetry before it hits costly cloud storage.
How to Action It: A 3-Step Adoption Blueprint
Deploy the OTel Collector as a DaemonSet:
Run the OpenTelemetry Collector on your Kubernetes clusters as a sidecar or DaemonSet to handle telemetry aggregation, batching, and routing off the main application thread.
Standardize Semantic Conventions:
Enforce consistent resource attributes across your services (e.g., service.name, deployment.environment, service.version) to enable instant filtering across all monitoring dashboards.
Implement Tail Sampling to Reduce SaaS Costs:
Configure the Collector’s tail-sampling processor to drop 100% of routine 200 OK traces while keeping 100% of errors (5xx) and slow traces (latency > 500ms), drastically cutting telemetry ingestion bills.
Key Takeaways
Instrumentation outlives backends: Instrument your application once with open standards instead of rewriting code for every vendor change.
Reduce cloud ingestion costs: Use the OTel Collector to filter, batch, and sample high-cardinality telemetry before shipping it off.
Contextual debugging: W3C context propagation bridges logs, metrics, and traces into a single, seamless troubleshooting workflow.
CTA (Join Techawks USA)
Navigating complex distributed systems and enterprise infrastructure?
Join Techawks USA today. Connect with principal software architects, SREs, and platform leaders sharing battle-tested strategies for observability, resilience, and cloud optimization.
If your platform engineering team is managing multiple third-party agents across Kubernetes clusters or multi-region cloud deployments, OTel should be in your architecture stack.
OpenTelemetry provides a single set of APIs, SDKs, and a processing Collector to generate, enrich, and export telemetry data—whether you route it to Datadog, Grafana, Honeycomb, or AWS CloudWatch.
┌────────────────────────────┐
│ Application Services & Apps │
└────────────────────────────┘
│ (Traces, Metrics, Logs)
▼
┌────────────────────────────┐
│ OpenTelemetry Collector │
│ (Local Buffering, Filtering & Enrichment) │
└───────┬─────────────────── ┘
│ │ │
▼ ▼ ▼
┌─────────────┐ ┌─────────────┐ ┌ ─┐
│ Datadog/SaaS│ │ Grafana/Prom│ │ AWS S3 / SQS│
└─────────────┘ └─────────────┘ └ ─┘
Key Strengths for Enterprise Systems
Zero Vendor Lock-in: Decouple data collection from analysis. Swap or add monitoring backends simply by updating your Collector configuration file without changing application code.
Unified Telemetry Stream: Automatically correlate traces, metrics, and logs using W3C Trace Context, allowing engineers to drill down from a p99 latency spike directly to the exact failing line of code.
The OpenTelemetry Collector: Acts as a proxy layer in your cluster to aggregate, scrub sensitive PII, compress, and sample high-volume telemetry before it hits costly cloud storage.
How to Action It: A 3-Step Adoption Blueprint
Deploy the OTel Collector as a DaemonSet:
Run the OpenTelemetry Collector on your Kubernetes clusters as a sidecar or DaemonSet to handle telemetry aggregation, batching, and routing off the main application thread.
Standardize Semantic Conventions:
Enforce consistent resource attributes across your services (e.g., service.name, deployment.environment, service.version) to enable instant filtering across all monitoring dashboards.
Implement Tail Sampling to Reduce SaaS Costs:
Configure the Collector’s tail-sampling processor to drop 100% of routine 200 OK traces while keeping 100% of errors (5xx) and slow traces (latency > 500ms), drastically cutting telemetry ingestion bills.
Key Takeaways
Instrumentation outlives backends: Instrument your application once with open standards instead of rewriting code for every vendor change.
Reduce cloud ingestion costs: Use the OTel Collector to filter, batch, and sample high-cardinality telemetry before shipping it off.
Contextual debugging: W3C context propagation bridges logs, metrics, and traces into a single, seamless troubleshooting workflow.
CTA (Join Techawks USA)
Navigating complex distributed systems and enterprise infrastructure?
Join Techawks USA today. Connect with principal software architects, SREs, and platform leaders sharing battle-tested strategies for observability, resilience, and cloud optimization.
Tool Review: Why OpenTelemetry (OTel) Is the Essential Engine for Modern US Cloud Observability
If your platform engineering team is managing multiple third-party agents across Kubernetes clusters or multi-region cloud deployments, OTel should be in your architecture stack.
OpenTelemetry provides a single set of APIs, SDKs, and a processing Collector to generate, enrich, and export telemetry data—whether you route it to Datadog, Grafana, Honeycomb, or AWS CloudWatch.
┌────────────────────────────┐
│ Application Services & Apps │
└────────────────────────────┘
│ (Traces, Metrics, Logs)
▼
┌────────────────────────────┐
│ OpenTelemetry Collector │
│ (Local Buffering, Filtering & Enrichment) │
└───────┬─────────────────── ┘
│ │ │
▼ ▼ ▼
┌─────────────┐ ┌─────────────┐ ┌ ─┐
│ Datadog/SaaS│ │ Grafana/Prom│ │ AWS S3 / SQS│
└─────────────┘ └─────────────┘ └ ─┘
Key Strengths for Enterprise Systems
Zero Vendor Lock-in: Decouple data collection from analysis. Swap or add monitoring backends simply by updating your Collector configuration file without changing application code.
Unified Telemetry Stream: Automatically correlate traces, metrics, and logs using W3C Trace Context, allowing engineers to drill down from a p99 latency spike directly to the exact failing line of code.
The OpenTelemetry Collector: Acts as a proxy layer in your cluster to aggregate, scrub sensitive PII, compress, and sample high-volume telemetry before it hits costly cloud storage.
How to Action It: A 3-Step Adoption Blueprint
Deploy the OTel Collector as a DaemonSet:
Run the OpenTelemetry Collector on your Kubernetes clusters as a sidecar or DaemonSet to handle telemetry aggregation, batching, and routing off the main application thread.
Standardize Semantic Conventions:
Enforce consistent resource attributes across your services (e.g., service.name, deployment.environment, service.version) to enable instant filtering across all monitoring dashboards.
Implement Tail Sampling to Reduce SaaS Costs:
Configure the Collector’s tail-sampling processor to drop 100% of routine 200 OK traces while keeping 100% of errors (5xx) and slow traces (latency > 500ms), drastically cutting telemetry ingestion bills.
Key Takeaways
Instrumentation outlives backends: Instrument your application once with open standards instead of rewriting code for every vendor change.
Reduce cloud ingestion costs: Use the OTel Collector to filter, batch, and sample high-cardinality telemetry before shipping it off.
Contextual debugging: W3C context propagation bridges logs, metrics, and traces into a single, seamless troubleshooting workflow.
CTA (Join Techawks USA)
Navigating complex distributed systems and enterprise infrastructure?
Join Techawks USA today. Connect with principal software architects, SREs, and platform leaders sharing battle-tested strategies for observability, resilience, and cloud optimization.

 Arabic
 French
 Spanish
 Portuguese
 Deutsch
 Turkish
 Dutch
Dutch
 Italiano
 Russian
 Romaian
 Portuguese (Brazil)
 Greek
Greek