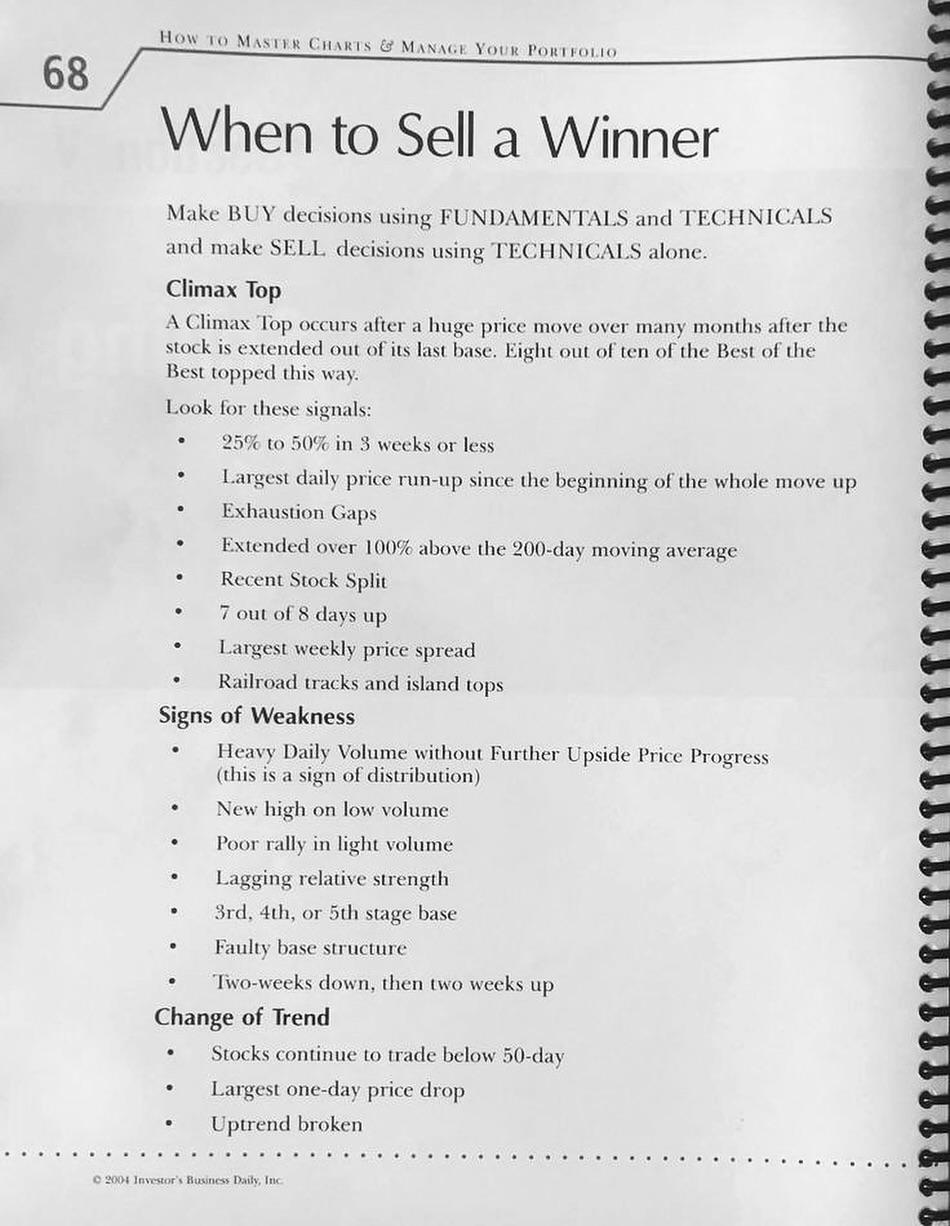
Knowing when to sell a stock that’s been a big winner is one of the hardest parts of investing but also one of the most crucial for protecting gains. This page offers a clear, technical approach to spotting potential tops and exit signals.
One of the most powerful signals is a “climax top.” This often shows up as a parabolic price move 25–50% in just a few weeks, especially after a long-term uptrend. You’ll often see the largest daily or weekly price spikes of the whole move, combined with excessive distance from the 200-day moving average. This kind of price behavior reflects exhaustion and euphoria not sustainable demand. Other red flags include unusual gaps, a recent stock split, or the price rising on 7 out of 8 days.
There are also more subtle signs of weakness: volume drying up during rallies, failed breakouts, and poor relative strength. These clues can suggest institutional selling, even if the price hasn’t broken down yet. If the chart is in a later-stage base or volume comes in heavy without follow-through, take note.
The ultimate confirmation comes when trendlines break. A sustained move below the 50-day moving average, a major one-day drop, or a broken uptrend are all signs the run may be over.
You buy with fundamentals and technicals. But you sell with technicals alone.
#StockMarket #InvestingTips #TechnicalAnalysis #SellSignals #RiskManagement #MomentumTrading #ChartPatterns #PriceAction #MarketTiming #SwingTrading #InvestmentStrategy #TradingPsychology
Knowing when to sell a stock that’s been a big winner is one of the hardest parts of investing but also one of the most crucial for protecting gains. This page offers a clear, technical approach to spotting potential tops and exit signals.
One of the most powerful signals is a “climax top.” This often shows up as a parabolic price move 25–50% in just a few weeks, especially after a long-term uptrend. You’ll often see the largest daily or weekly price spikes of the whole move, combined with excessive distance from the 200-day moving average. This kind of price behavior reflects exhaustion and euphoria not sustainable demand. Other red flags include unusual gaps, a recent stock split, or the price rising on 7 out of 8 days.
There are also more subtle signs of weakness: volume drying up during rallies, failed breakouts, and poor relative strength. These clues can suggest institutional selling, even if the price hasn’t broken down yet. If the chart is in a later-stage base or volume comes in heavy without follow-through, take note.
The ultimate confirmation comes when trendlines break. A sustained move below the 50-day moving average, a major one-day drop, or a broken uptrend are all signs the run may be over.
You buy with fundamentals and technicals. But you sell with technicals alone.
#StockMarket #InvestingTips #TechnicalAnalysis #SellSignals #RiskManagement #MomentumTrading #ChartPatterns #PriceAction #MarketTiming #SwingTrading #InvestmentStrategy #TradingPsychology
·783 مشاهدة
·0 معاينة