

• The AI Agent Architecture Blueprint: 4 Components for Autonomous Workflows


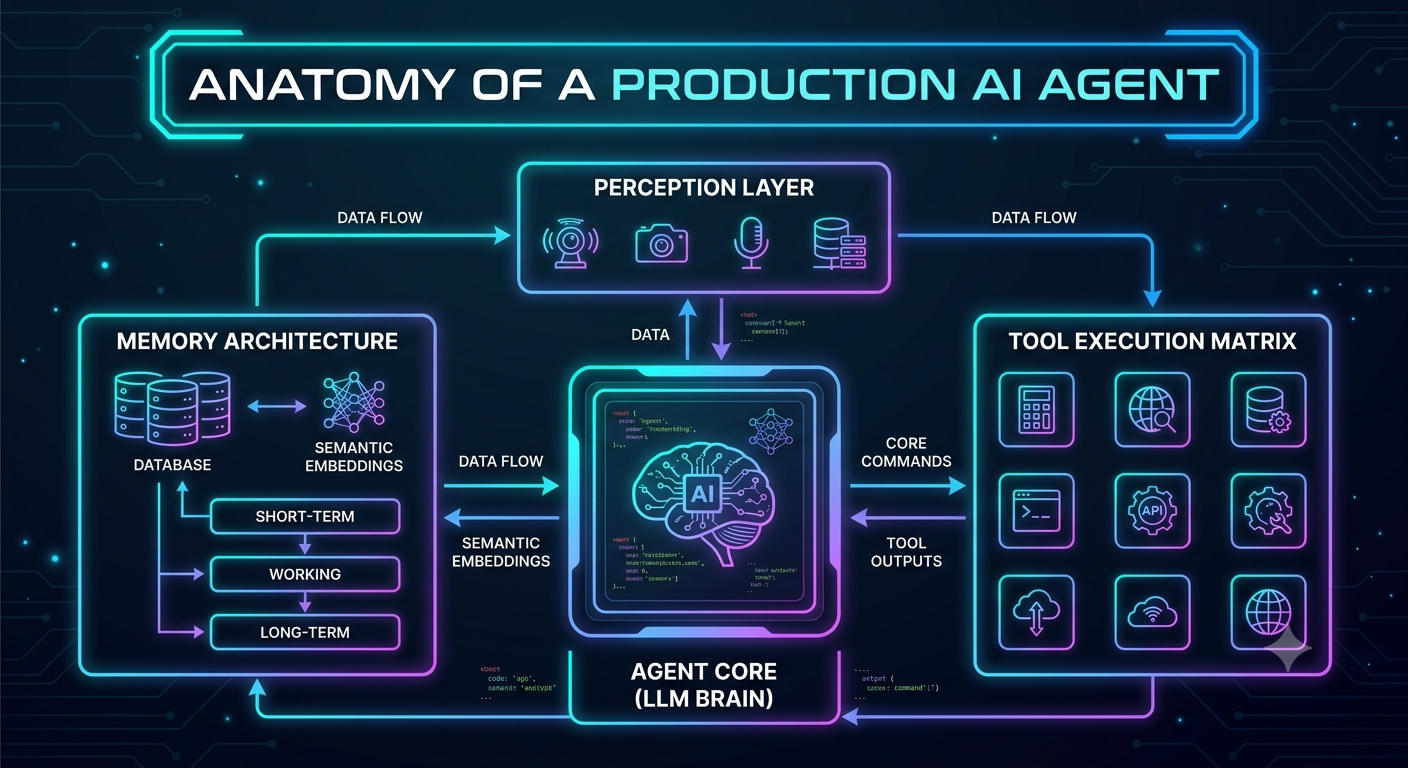
    Moving from static single-prompt completions to autonomous agents requires orchestrating feedback loops. Every production-grade AI agent relies on 4 Fundamental Building Blocks:


    +-----------------------------------------------------------------------------+
    | 1. PERCEPTION |
    | (User Input, Environment Sensors, Multimodal Parsers) |
    +------------------------------+----------------------------------------------+
    |
    v
    +----------------------------------------------------------------------------+
    | 2. BRAIN (LLM) |
    | (Task Decomposition, Planning, Decision Reasoning) |
    +--------------+-------------------------------+----------------------------+
    | ^
    v |
    +------------------------------+---------------+---------------------------+
    | 3. MEMORY | 4. TOOLS |
    | (Short-term: Conversation) | (APIs, Code Interpreters, |
    | (Long-term: Vector Store) | Database Connectors) |
    +------------------------------+--------------------------------------------+


    1. Perception (The Ingestion Layer)
    Function: Translates raw inputs—text, structured JSON, code, or images—into normalized context the LLM can evaluate.
    Best Practice: Always sanitize inputs and explicitly separate system instructions from untrusted user content to prevent prompt injection attacks.


    2. The Brain (Planning & Decision Engine)
    Function: Breaks down a high-level goal into smaller, sequential sub-tasks.
    Best Practice: Implement structured planning techniques like ReAct (Reasoning + Acting) or Plan-and-Solve. Enforce a maximum step limit (e.g., max 10 execution loops) to prevent infinite loops when an agent gets stuck.


    3. Memory System (Context Persistence)
    Short-Term Memory: Retains immediate chat history within the active context window.
    Long-Term Memory: Uses semantic search over vector databases to retrieve past execution logs, user preferences, or domain knowledge when relevant.
    Best Practice: Periodically summarize short-term context to conserve token limits and keep inference latency low.


    4. Tool Execution (Action Layer)
    Function: Gives the agent "hands" to interact with external systems via API calls, SQL queries, or custom code execution.
    Best Practice: Never give an agent write access to production databases or external APIs without human-in-the-loop (HITL) approval gates for destructive actions.


    Key Takeaways
    Limit autonomous loops: Guard against budget burn and infinite recursion by placing strict step limits on reasoning loops.
    Decouple planning from execution: Let the LLM plan actions in structured formats (like JSON), but let deterministic code validate and execute those actions.
    Implement Human-in-the-Loop (HITL): Require manual verification for critical operations (e.g., payments, data deletions, external emails).


    CTA
    Building autonomous agents, RAG systems, or AI infrastructure?
    Join the AI Builders & Enthusiasts community today to access step-by-step system designs, code templates, and technical discussions with fellow AI developers!
    The AI Agent Architecture Blueprint: 4 Components for Autonomous Workflows Moving from static single-prompt completions to autonomous agents requires orchestrating feedback loops. Every production-grade AI agent relies on 4 Fundamental Building Blocks: +-----------------------------------------------------------------------------+ | 1. PERCEPTION | | (User Input, Environment Sensors, Multimodal Parsers) | +------------------------------+----------------------------------------------+ | v +----------------------------------------------------------------------------+ | 2. BRAIN (LLM) | | (Task Decomposition, Planning, Decision Reasoning) | +--------------+-------------------------------+----------------------------+ | ^ v | +------------------------------+---------------+---------------------------+ | 3. MEMORY | 4. TOOLS | | (Short-term: Conversation) | (APIs, Code Interpreters, | | (Long-term: Vector Store) | Database Connectors) | +------------------------------+--------------------------------------------+ 1. Perception (The Ingestion Layer) Function: Translates raw inputs—text, structured JSON, code, or images—into normalized context the LLM can evaluate. Best Practice: Always sanitize inputs and explicitly separate system instructions from untrusted user content to prevent prompt injection attacks. 2. The Brain (Planning & Decision Engine) Function: Breaks down a high-level goal into smaller, sequential sub-tasks. Best Practice: Implement structured planning techniques like ReAct (Reasoning + Acting) or Plan-and-Solve. Enforce a maximum step limit (e.g., max 10 execution loops) to prevent infinite loops when an agent gets stuck. 3. Memory System (Context Persistence) Short-Term Memory: Retains immediate chat history within the active context window. Long-Term Memory: Uses semantic search over vector databases to retrieve past execution logs, user preferences, or domain knowledge when relevant. Best Practice: Periodically summarize short-term context to conserve token limits and keep inference latency low. 4. Tool Execution (Action Layer) Function: Gives the agent "hands" to interact with external systems via API calls, SQL queries, or custom code execution. Best Practice: Never give an agent write access to production databases or external APIs without human-in-the-loop (HITL) approval gates for destructive actions. Key Takeaways Limit autonomous loops: Guard against budget burn and infinite recursion by placing strict step limits on reasoning loops. Decouple planning from execution: Let the LLM plan actions in structured formats (like JSON), but let deterministic code validate and execute those actions. Implement Human-in-the-Loop (HITL): Require manual verification for critical operations (e.g., payments, data deletions, external emails). CTA Building autonomous agents, RAG systems, or AI infrastructure? Join the AI Builders & Enthusiasts community today to access step-by-step system designs, code templates, and technical discussions with fellow AI developers!

    0 Comments 0 Shares 517 Views 0 Reviews
  • 0 Comments 0 Shares 370 Views 0 Reviews
  • 0 Comments 0 Shares 377 Views 0 Reviews
  • I recently downloaded the PikaShow APK using the guide on this site, and the process was quick and easy to follow. The installation steps were clearly explained, making everything simple even for beginners. Thanks for providing updated information, useful tips, and a reliable download guide. Keep up the excellent work! https://pikashowtve.in/
    I recently downloaded the PikaShow APK using the guide on this site, and the process was quick and easy to follow. The installation steps were clearly explained, making everything simple even for beginners. Thanks for providing updated information, useful tips, and a reliable download guide. Keep up the excellent work! https://pikashowtve.in/
    PIKASHOWTVE.IN
    PikaShow APK Download (*July 2026*) v93 Latest Version
    PikaShow is a third-party streaming application designed mainly for Android users. The app alows users to access movies, live TV channels, sports events, web
    0 Comments 0 Shares 373 Views 0 Reviews
  • Revealed: Investment Opportunities in the Venture Capital Advisory Services Market by 2035
    reaching an expected market size of $22.7 billion by 2035, investment opportunities are becoming increasingly evident. With a compound annual growth rate (CAGR) of 5.57%, this sector presents a compelling landscape for investors seeking to capitalize on burgeoning startups and innovative technologies. The current landscape indicates that advisory services, particularly in fundraising...
    0 Comments 0 Shares 396 Views 0 Reviews
  • Why Digital Disruption is Defining the France Personal Loans Market Competitive Landscape
    The competitive landscape of the France Personal Loans Market is undergoing a profound transformation, propelled by digital disruption and evolving consumer preferences. With the market size projected to expand from 3,250 million USD in 2024 to a staggering 71,000 million USD by 2035, the trends shaping this growth are critical for stakeholders to understand. The forecasted compound annual...
    0 Comments 0 Shares 391 Views 0 Reviews
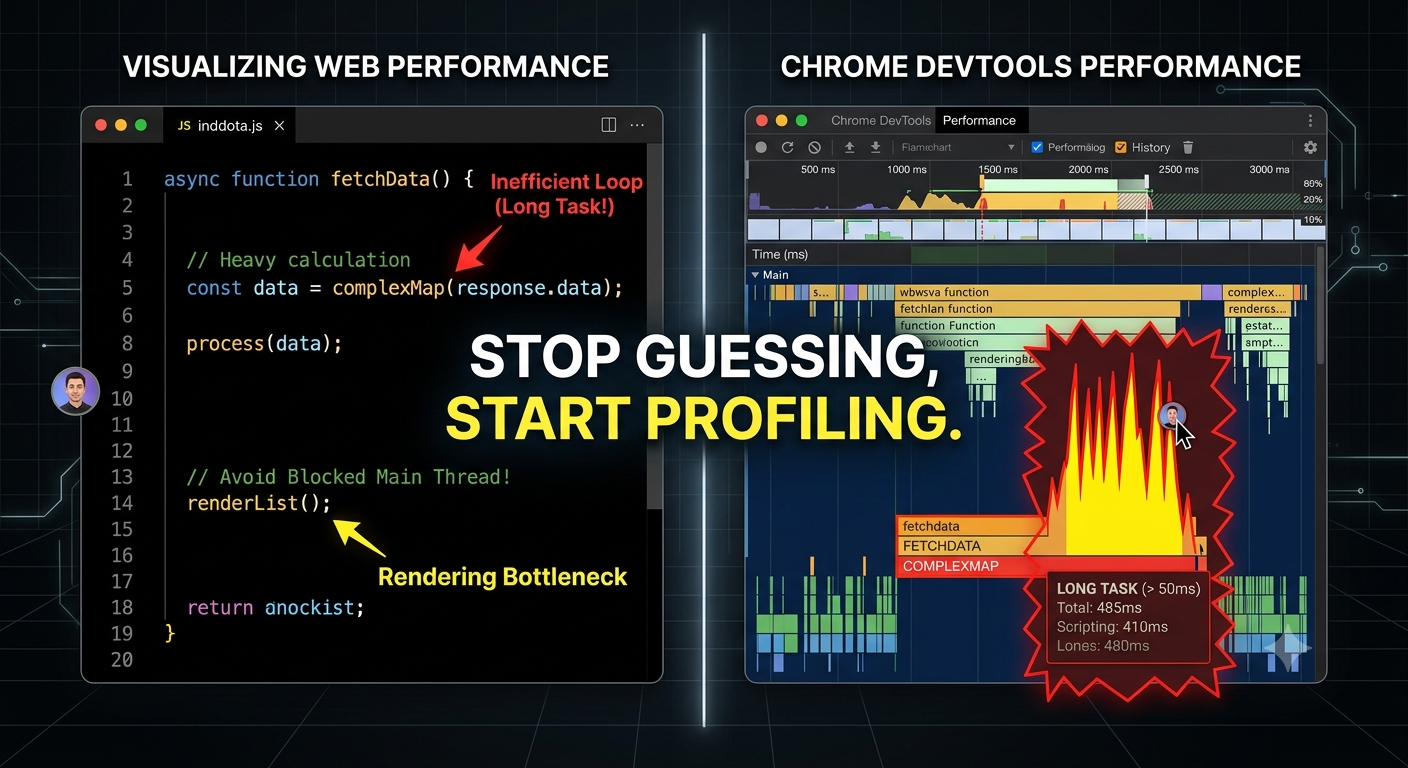
  • Stop Guessing, Start Profiling: Why Chrome DevTools’ Performance Panel is the Ultimate Frontend Debugger


    You’ve optimized your React state, purged unused CSS, and compressed every image on the site—so why does your app still feel sluggish on low-tier devices? Most developers debug performance by guessing. Let’s look at how to actually see where your runtime budget is leaking.
    When an application drops frames, the knee-jerk reaction is often to blame framework overhead or heavy re-renders. But without hard data, optimization attempts are just shots in the dark.
    The Chrome DevTools Performance Panel is arguably the most powerful—and underutilized—tool in a web developer's arsenal for diagnosing runtime bottlenecks. Here is how to run a clean runtime audit in three actionable steps:


    1. Eliminate Environment Noise
    Profiling on a top-tier developer workstation distorts reality. Before recording:
    Open a Clean Incognito Window (prevents browser extensions from skewing execution times).
    Go to the Performance Panel settings (gear icon) and set CPU Throttling to 4x or 6x slowdown.
    Set Network to Fast 3G to simulate real-world mobile CPU and connection constraints.


    2. Record and Locate Main-Thread Blockers
    Hit Record, perform the single user interaction that feels slow (e.g., opening a complex modal or filtering a table), and stop the recording immediately. Keep recordings short (3–5 seconds) to avoid data overload.
    Look directly at the Main flame chart. Long tasks will be flagged with a red corner indicator:
    Yellow blocks (Scripting): High JavaScript execution time. Look for deep call stacks indicating recursive functions or un-memoized heavy calculations.
    Purple blocks (Rendering): Style recalculations and layout thrashing. Often caused by reading element layout properties (like offsetHeight) right after mutating the DOM in a loop.
    Green blocks (Painting): Compositing and paint bottlenecks, usually solved by delegating animations to GPU-accelerated CSS properties (transform, opacity).


    3. Trace Call Stacks to Source Code
    Click on any long yellow task in the Main thread view, then check the Bottom-Up or Call Tree tab at the bottom panel. Sort by Self Time to see which specific function ate up the CPU cycles, then click the source link to jump straight to the offending line in your code.


    Key Takeaways
    Profile before refactoring: Never optimize based on intuition; let execution data guide your code changes.
    Throttle your environment: CPU throttling reveals real-world micro-stutters you’ll never notice on a high-end dev setup.
    Watch for Layout Thrashing: Avoid reading geometry properties immediately after DOM writes within execution loops.


    CTA
    Want to sharpen your frontend engineering skills alongside a community of active builders? Join Developers & Coding on Techawks today to share techniques, review code, and level up your stack.
    Stop Guessing, Start Profiling: Why Chrome DevTools’ Performance Panel is the Ultimate Frontend Debugger You’ve optimized your React state, purged unused CSS, and compressed every image on the site—so why does your app still feel sluggish on low-tier devices? Most developers debug performance by guessing. Let’s look at how to actually see where your runtime budget is leaking. When an application drops frames, the knee-jerk reaction is often to blame framework overhead or heavy re-renders. But without hard data, optimization attempts are just shots in the dark. The Chrome DevTools Performance Panel is arguably the most powerful—and underutilized—tool in a web developer's arsenal for diagnosing runtime bottlenecks. Here is how to run a clean runtime audit in three actionable steps: 1. Eliminate Environment Noise Profiling on a top-tier developer workstation distorts reality. Before recording: Open a Clean Incognito Window (prevents browser extensions from skewing execution times). Go to the Performance Panel settings (gear icon) and set CPU Throttling to 4x or 6x slowdown. Set Network to Fast 3G to simulate real-world mobile CPU and connection constraints. 2. Record and Locate Main-Thread Blockers Hit Record, perform the single user interaction that feels slow (e.g., opening a complex modal or filtering a table), and stop the recording immediately. Keep recordings short (3–5 seconds) to avoid data overload. Look directly at the Main flame chart. Long tasks will be flagged with a red corner indicator: Yellow blocks (Scripting): High JavaScript execution time. Look for deep call stacks indicating recursive functions or un-memoized heavy calculations. Purple blocks (Rendering): Style recalculations and layout thrashing. Often caused by reading element layout properties (like offsetHeight) right after mutating the DOM in a loop. Green blocks (Painting): Compositing and paint bottlenecks, usually solved by delegating animations to GPU-accelerated CSS properties (transform, opacity). 3. Trace Call Stacks to Source Code Click on any long yellow task in the Main thread view, then check the Bottom-Up or Call Tree tab at the bottom panel. Sort by Self Time to see which specific function ate up the CPU cycles, then click the source link to jump straight to the offending line in your code. Key Takeaways Profile before refactoring: Never optimize based on intuition; let execution data guide your code changes. Throttle your environment: CPU throttling reveals real-world micro-stutters you’ll never notice on a high-end dev setup. Watch for Layout Thrashing: Avoid reading geometry properties immediately after DOM writes within execution loops. CTA Want to sharpen your frontend engineering skills alongside a community of active builders? Join Developers & Coding on Techawks today to share techniques, review code, and level up your stack.
    0 Comments 0 Shares 1K Views 0 Reviews
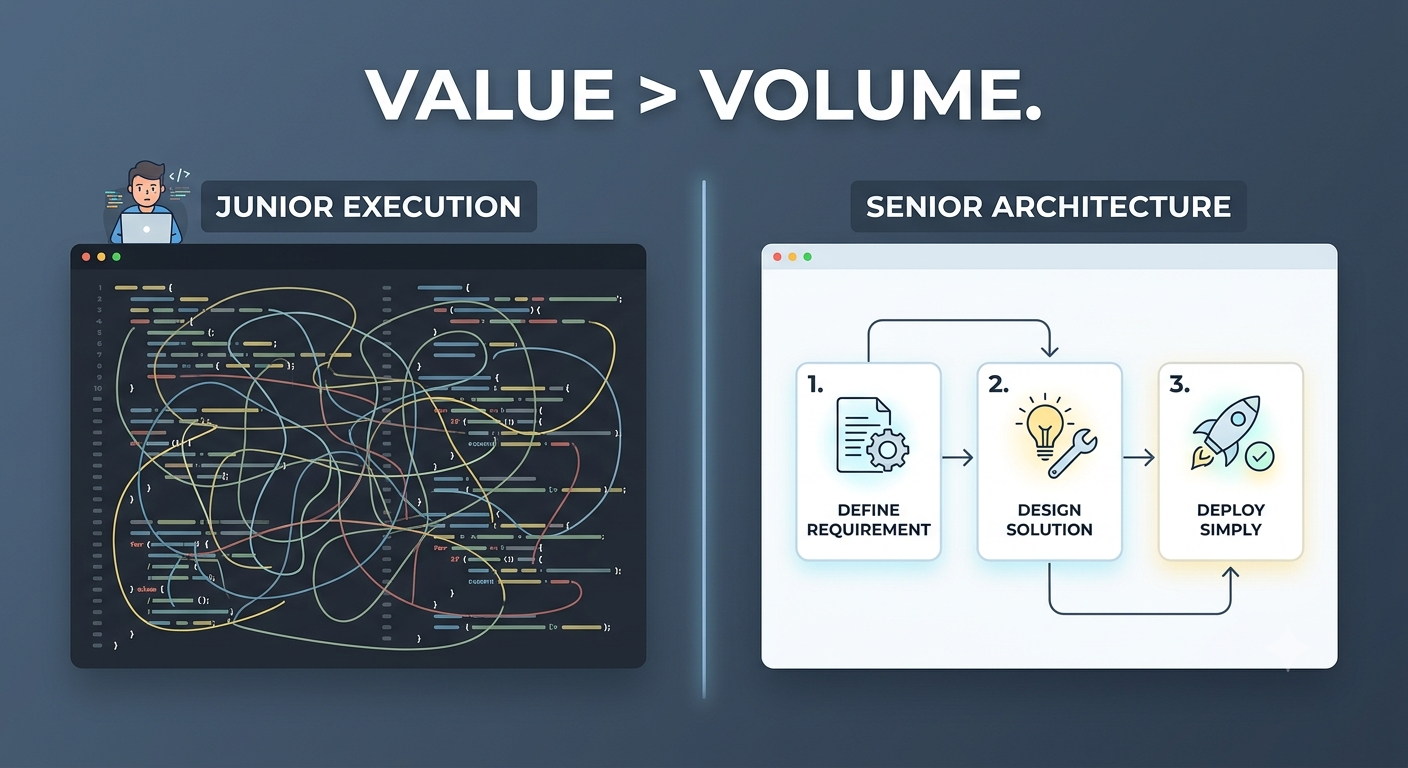
  • The Senior Engineer Mindset: Why Writing Less Code Is Often the Best Way to Ship


    Early in your career, technical prowess is measured by execution speed and complex problem-solving. However, breaking through the mid-level barrier into senior positions requires a fundamental shift in how you evaluate impact.
    Here are three mental models to help you level up your engineering strategy and stand out as a force multiplier on your team:


    1. Default to the Smallest Effective Surface Area
    Every line of custom code you deploy is a future liability—it requires testing, maintenance, and eventual refactoring. Before opening your IDE:
    Ask: "Can this problem be solved by configuring an existing tool or tweaking an established pattern?"
    Validate: Resist the urge to build custom utility libraries for problems that are already solved reliably in your framework’s ecosystem.


    2. Solve for Maintenance, Not Just Execution
    Code is read far more often than it is written. A clever one-liner might feel satisfying to commit, but if it takes a teammate 15 minutes to decipher during an incident, it’s a net loss for the team.
    Prioritize explicit over clever.
    Write code that communicates intent clearly so that future-you (and your peers) can debug it effortlessly at 2 AM.


    3. Translate Technical Trade-offs into Risk and Time
    Senior developers don't just present technical problems; they frame them in terms of trade-offs.
    Instead of saying:
    "We need to rewrite this service using microservices because the monolith is disorganized."
    Frame it as: "Refactoring this core module will reduce our deployment cycle time from two days to 20 minutes and lower the risk of cascading failures during peak load."
    When you tie engineering decisions to developer velocity, reliability, and risk, you instantly become a partner in product direction rather than just an execution unit.


    Key Takeaways
    Code is a liability, value is the asset: Measure your output by the problem solved, not the complexity of the solution.
    Optimize for readability: Write straightforward code that lowers cognitive load for reviewers and maintainers.
    Master trade-off communication: Articulate why a technical improvement matters in terms of time, risk, and stability.


    CTA
    Ready to elevate your engineering career and tackle real-world architecture challenges? Join Developers & Coding on Techawks today to connect with peers, get code reviews, and level up your software skills.
    The Senior Engineer Mindset: Why Writing Less Code Is Often the Best Way to Ship Early in your career, technical prowess is measured by execution speed and complex problem-solving. However, breaking through the mid-level barrier into senior positions requires a fundamental shift in how you evaluate impact. Here are three mental models to help you level up your engineering strategy and stand out as a force multiplier on your team: 1. Default to the Smallest Effective Surface Area Every line of custom code you deploy is a future liability—it requires testing, maintenance, and eventual refactoring. Before opening your IDE: Ask: "Can this problem be solved by configuring an existing tool or tweaking an established pattern?" Validate: Resist the urge to build custom utility libraries for problems that are already solved reliably in your framework’s ecosystem. 2. Solve for Maintenance, Not Just Execution Code is read far more often than it is written. A clever one-liner might feel satisfying to commit, but if it takes a teammate 15 minutes to decipher during an incident, it’s a net loss for the team. Prioritize explicit over clever. Write code that communicates intent clearly so that future-you (and your peers) can debug it effortlessly at 2 AM. 3. Translate Technical Trade-offs into Risk and Time Senior developers don't just present technical problems; they frame them in terms of trade-offs. Instead of saying: "We need to rewrite this service using microservices because the monolith is disorganized." Frame it as: "Refactoring this core module will reduce our deployment cycle time from two days to 20 minutes and lower the risk of cascading failures during peak load." When you tie engineering decisions to developer velocity, reliability, and risk, you instantly become a partner in product direction rather than just an execution unit. Key Takeaways Code is a liability, value is the asset: Measure your output by the problem solved, not the complexity of the solution. Optimize for readability: Write straightforward code that lowers cognitive load for reviewers and maintainers. Master trade-off communication: Articulate why a technical improvement matters in terms of time, risk, and stability. CTA Ready to elevate your engineering career and tackle real-world architecture challenges? Join Developers & Coding on Techawks today to connect with peers, get code reviews, and level up your software skills.
    0 Comments 0 Shares 944 Views 0 Reviews
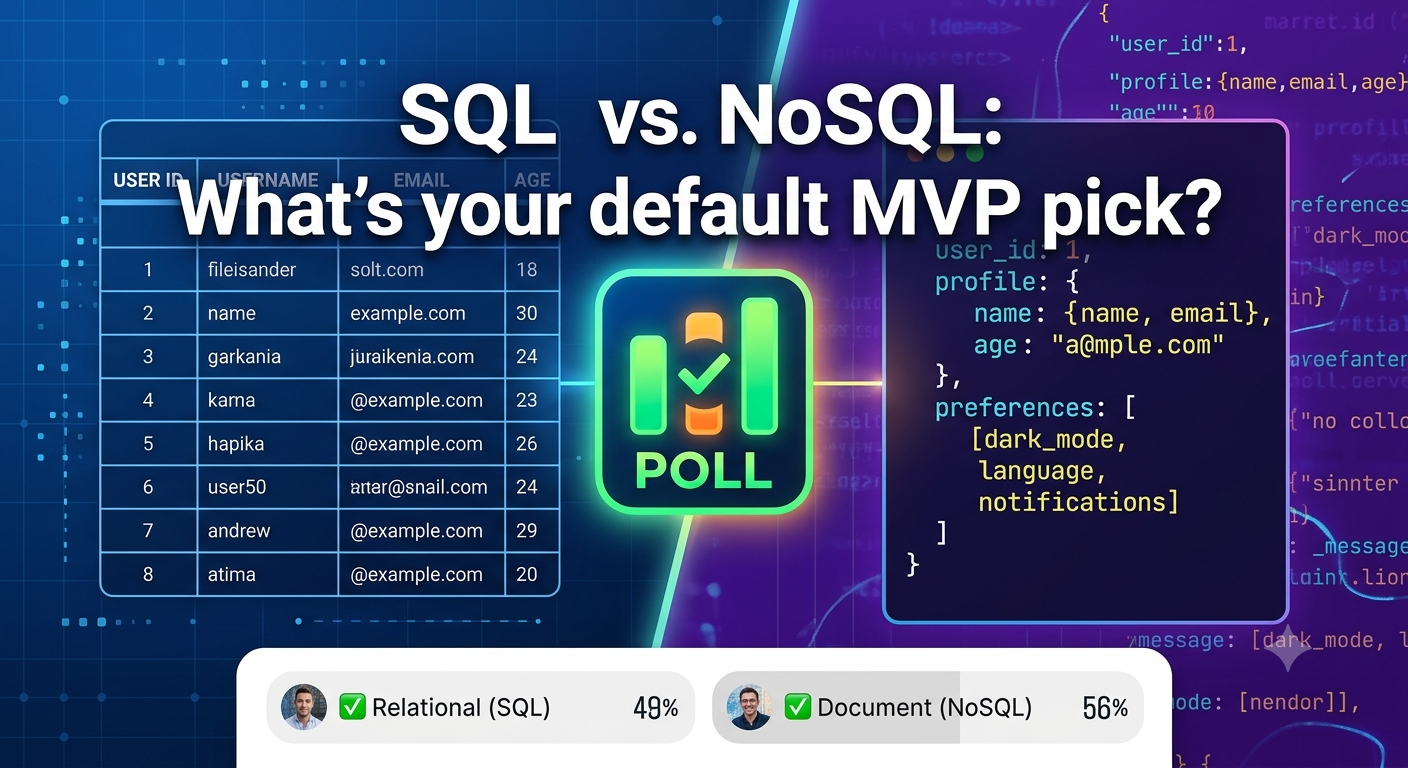
  • Database Selection Dilemma: Relational vs. Document Stores for New Projects
    Choosing between a Relational DB (like PostgreSQL or MySQL) and a Document Store (like MongoDB) isn't about which technology is "better"—it's about matching your data access patterns to your domain logic.
    Here is a quick framework to make the right call:


    Choose a Relational DB (SQL) when:
    Data integrity is non-negotiable: You require strict schema enforcement and full ACID compliance (e.g., financial transactions, inventory tracking).
    Relationships are complex: Your domain involves heavy cross-referencing, multi-table joins, and normalized structures.
    Query patterns are unpredictable: SQL allows you to run ad-hoc analytical queries without restructuring your entire dataset.


    Choose a Document Store (NoSQL) when:
    Schemas are fluid or evolving rapidly: You are prototyping rapidly or working with highly unstructured data where attributes vary per record.
    High-write throughput & horizontal scale: You need to partition data across multiple nodes with low-latency reads for pre-aggregated documents.
    Hierarchical data structures: Your entity contains nested arrays/objects that are naturally fetched and written together (e.g., user preferences or catalog items).


    📊 Community Poll
    When bootstrapping a brand-new production MVP today, what is your default database choice?
    🟢 PostgreSQL (Reliable, rich feature set, JSON support)
    🟡 MongoDB / Document DB (Flexible schema, rapid iteration)
    🔵 SQLite / Embedded DB (Lightweight, simple deployment)
    🟣 It depends entirely on the domain logic
    (Cast your vote in the comments below with a brief reason why!)


    Key Takeaways
    Design for access patterns: Choose your database based on how you write and read data, not just framework defaults.
    Postgres bridges the gap: Modern SQL databases handle JSON documents remarkably well, giving you flexibility alongside relational integrity.
    Avoid premature optimization: Pick the tool that minimizes architectural complexity for your team's current velocity.


    CTA
    Debating system architecture choices for your next big build? Join Developers & Coding on Techawks today to discuss database strategies, get code feedback, and level up with fellow engineers.
    Database Selection Dilemma: Relational vs. Document Stores for New Projects Choosing between a Relational DB (like PostgreSQL or MySQL) and a Document Store (like MongoDB) isn't about which technology is "better"—it's about matching your data access patterns to your domain logic. Here is a quick framework to make the right call: Choose a Relational DB (SQL) when: Data integrity is non-negotiable: You require strict schema enforcement and full ACID compliance (e.g., financial transactions, inventory tracking). Relationships are complex: Your domain involves heavy cross-referencing, multi-table joins, and normalized structures. Query patterns are unpredictable: SQL allows you to run ad-hoc analytical queries without restructuring your entire dataset. Choose a Document Store (NoSQL) when: Schemas are fluid or evolving rapidly: You are prototyping rapidly or working with highly unstructured data where attributes vary per record. High-write throughput & horizontal scale: You need to partition data across multiple nodes with low-latency reads for pre-aggregated documents. Hierarchical data structures: Your entity contains nested arrays/objects that are naturally fetched and written together (e.g., user preferences or catalog items). 📊 Community Poll When bootstrapping a brand-new production MVP today, what is your default database choice? 🟢 PostgreSQL (Reliable, rich feature set, JSON support) 🟡 MongoDB / Document DB (Flexible schema, rapid iteration) 🔵 SQLite / Embedded DB (Lightweight, simple deployment) 🟣 It depends entirely on the domain logic (Cast your vote in the comments below with a brief reason why!) Key Takeaways Design for access patterns: Choose your database based on how you write and read data, not just framework defaults. Postgres bridges the gap: Modern SQL databases handle JSON documents remarkably well, giving you flexibility alongside relational integrity. Avoid premature optimization: Pick the tool that minimizes architectural complexity for your team's current velocity. CTA Debating system architecture choices for your next big build? Join Developers & Coding on Techawks today to discuss database strategies, get code feedback, and level up with fellow engineers.
    0 Comments 0 Shares 932 Views 0 Reviews
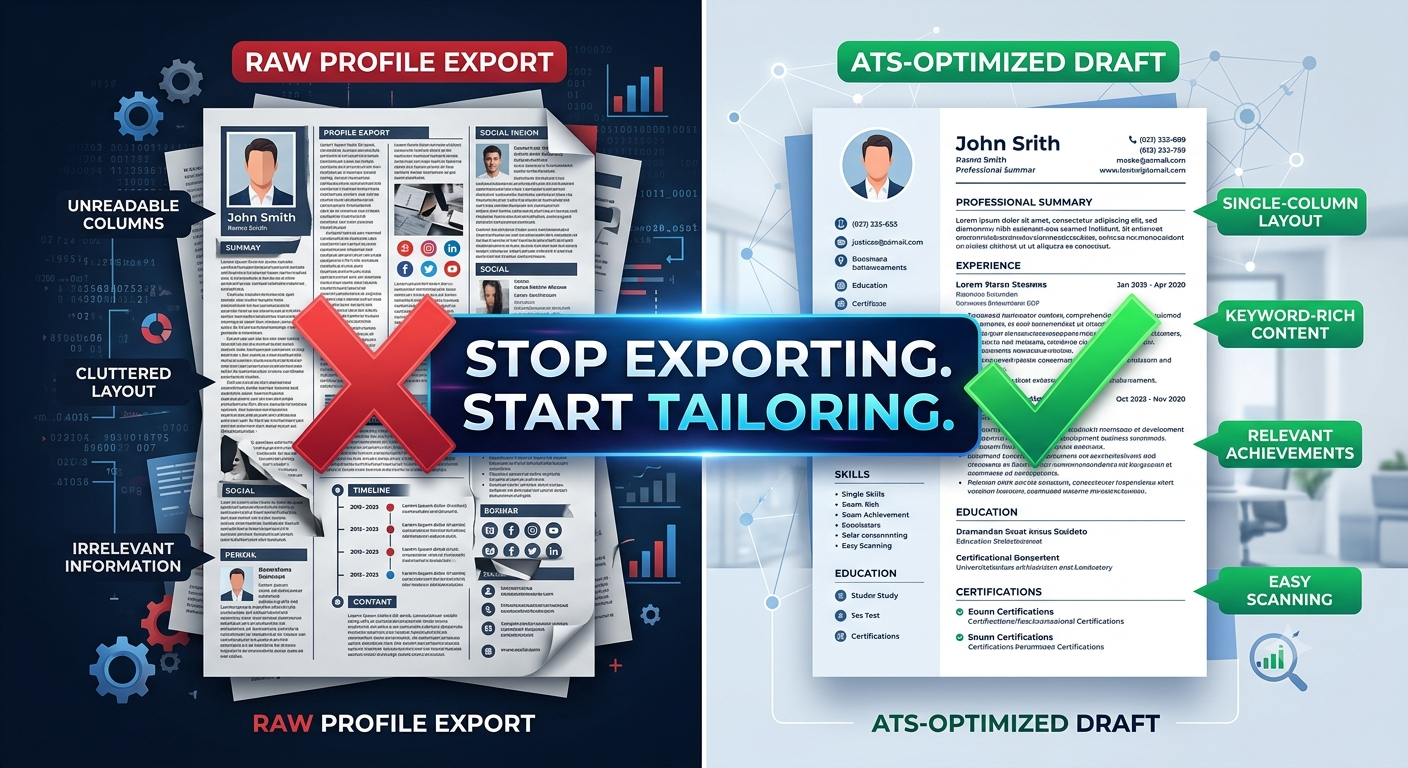
  • Tool Review: LinkedIn’s Native Resume Builder vs. "Save to PDF"


    When job hunting, speed matters, but sending out a generic profile dump is a major reason applications vanish into a black hole.
    LinkedIn offers two native ways to turn your profile into a document: the "Save to PDF" function and the lesser-known "Build a Resume" feature. Here is a practical breakdown of how they compare and how to use the built-in resume tool effectively.


    The Comparison: "Save to PDF" vs. "Build a Resume
    "Feature "Save to PDF" Button Built-In "Build a Resume" Tool
    Output Raw profile dump Customized 1-2 page document
    ATS Readability Poor (multi-column structure, non-standard headers) High (single-column layout, standard headers)
    Tailoring Ability Zero (exports everything as-is) High (edit, reorder, or delete bullet points per job application)
    Keyword Match None Includes a keyword insights engine based on target job titles


    How to Use the Built-In Resume Tool (3 Actionable Steps)
    1. Access the Tool from Desktop
    Navigate to your profile on a desktop browser. Click the "More" button near your profile picture and select "Build a resume." Select "Create from profile."


    2. Set Your Target Job Title for Keyword Optimization
    The tool will prompt you to enter a target job title (e.g., "Software Engineer" or "Product Manager").
    LinkedIn compares your profile content against common recruiter search terms for that role.
    Use the "Keyword Insights" panel on the right sidebar to check which critical industry keywords are present in your draft and which ones you should add.


    3. Strip Out "Social Media Fluff"
    Your LinkedIn profile is designed for passive scrolling; your resume is designed for concise evaluation. Before downloading:
    Shorten the summary: Condense a long narrative "About" section into a 3-line elevator pitch.
    Trim bullet points: Convert paragraphs under past roles into 3–4 achievement-focused points using strong action verbs.
    Remove non-essential sections: Uncheck irrelevant items (like personal causes or hobbies) so the layout stays tightly focused on professional impact.


    Key Takeaways
    Avoid "Save to PDF" for applications: It outputs a bloated profile export that struggles with ATS parsers.
    Leverage built-in keyword checks: Use LinkedIn’s target job title feature to ensure your key skills match what recruiters search for.
    Format for the reader: Strip out social narrative text and present clean, impact-driven bullet points.


    CTA
    Looking for guidance on navigating job applications, refining your interview approach, or finding your next role? Join Tech Jobs & Opportunities on Techawks today to get expert tips and discover open positions.
    Tool Review: LinkedIn’s Native Resume Builder vs. "Save to PDF" When job hunting, speed matters, but sending out a generic profile dump is a major reason applications vanish into a black hole. LinkedIn offers two native ways to turn your profile into a document: the "Save to PDF" function and the lesser-known "Build a Resume" feature. Here is a practical breakdown of how they compare and how to use the built-in resume tool effectively. The Comparison: "Save to PDF" vs. "Build a Resume "Feature "Save to PDF" Button Built-In "Build a Resume" Tool Output Raw profile dump Customized 1-2 page document ATS Readability Poor (multi-column structure, non-standard headers) High (single-column layout, standard headers) Tailoring Ability Zero (exports everything as-is) High (edit, reorder, or delete bullet points per job application) Keyword Match None Includes a keyword insights engine based on target job titles How to Use the Built-In Resume Tool (3 Actionable Steps) 1. Access the Tool from Desktop Navigate to your profile on a desktop browser. Click the "More" button near your profile picture and select "Build a resume." Select "Create from profile." 2. Set Your Target Job Title for Keyword Optimization The tool will prompt you to enter a target job title (e.g., "Software Engineer" or "Product Manager"). LinkedIn compares your profile content against common recruiter search terms for that role. Use the "Keyword Insights" panel on the right sidebar to check which critical industry keywords are present in your draft and which ones you should add. 3. Strip Out "Social Media Fluff" Your LinkedIn profile is designed for passive scrolling; your resume is designed for concise evaluation. Before downloading: Shorten the summary: Condense a long narrative "About" section into a 3-line elevator pitch. Trim bullet points: Convert paragraphs under past roles into 3–4 achievement-focused points using strong action verbs. Remove non-essential sections: Uncheck irrelevant items (like personal causes or hobbies) so the layout stays tightly focused on professional impact. Key Takeaways Avoid "Save to PDF" for applications: It outputs a bloated profile export that struggles with ATS parsers. Leverage built-in keyword checks: Use LinkedIn’s target job title feature to ensure your key skills match what recruiters search for. Format for the reader: Strip out social narrative text and present clean, impact-driven bullet points. CTA Looking for guidance on navigating job applications, refining your interview approach, or finding your next role? Join Tech Jobs & Opportunities on Techawks today to get expert tips and discover open positions.
    0 Comments 0 Shares 1K Views 0 Reviews