


-
Tool Review: OpenTelemetry eBPF Instrumentation (OBI) — The End of Manual Tracing SDKs
Instrumenting distributed architectures has long been an engineering tax: rewriting runtime imports, handling language SDK incompatibilities, patching third-party dependencies, and redeploying entire container clusters just to trace an edge latency spike.
The shift toward OpenTelemetry eBPF Instrumentation (OBI) represents a architectural leap forward for modern cloud-native systems: zero-code, kernel-level telemetry.
1. How OBI Works Under the Hood
Instead of injecting bytecode or forcing teams to wrap internal HTTP and RPC handlers inside user-space application code, OBI attaches sandboxed eBPF probes directly into kernel-level network and system call interfaces:
Zero Application Restarts: Probes hook into socket events, system calls (sys_enter, sys_exit), and process thread boundaries in real time.
Kernel-Level Context Propagation: Automatically tracks and correlates distributed trace headers (such as W3C traceparent) across microservice boundaries, gRPC payloads, TLS/SSL streams, and databases (PostgreSQL, Redis, MySQL).
Polyglot Uniformity: Works natively across Go, Rust, C/C++, Java, Python, and Node.js without writing distinct SDK wrappers for each stack.
2. The Architectural Win: Eliminating User-Space Overhead
Traditional runtime tracing agents introduce memory bloat and garbage collection pauses into production pods.
Minimal Footprint: eBPF bytecode executes via the in-kernel JIT compiler with strict safety verifications, sidestepping user-space execution loops.
Unified Pipeline: Spans, network round-trip times (RTT), and thread profiling stream straight into standard OpenTelemetry Collector receivers using OpenTelemetry Protocol (OTLP).
3. Where Manual Instrumentation Still Wins
OBI does not completely replace application-level code:
Business-Logic Spans: Kernel probes observe network hops, I/O latency, and query duration, but they cannot inherently infer domain-specific context (e.g., cart size, checkout flags, or tenant routing IDs).
The Hybrid Standard: High-velocity engineering teams use OBI as the baseline fabric for instant cluster-wide visibility, and layer targeted, manual OpenTelemetry API spans only for mission-critical domain logic.
Discussion Question
Is your organization still manually managing language-specific tracing SDKs in microservice codebases, or have you started testing zero-code eBPF instrumentation in your Kubernetes clusters?
CTA
Join Techawks General Community: Connect with software architects, cloud engineers, and developers discussing production infrastructure patterns, system design, and emerging engineering tooling.Tool Review: OpenTelemetry eBPF Instrumentation (OBI) — The End of Manual Tracing SDKs Instrumenting distributed architectures has long been an engineering tax: rewriting runtime imports, handling language SDK incompatibilities, patching third-party dependencies, and redeploying entire container clusters just to trace an edge latency spike. The shift toward OpenTelemetry eBPF Instrumentation (OBI) represents a architectural leap forward for modern cloud-native systems: zero-code, kernel-level telemetry. 1. How OBI Works Under the Hood Instead of injecting bytecode or forcing teams to wrap internal HTTP and RPC handlers inside user-space application code, OBI attaches sandboxed eBPF probes directly into kernel-level network and system call interfaces: Zero Application Restarts: Probes hook into socket events, system calls (sys_enter, sys_exit), and process thread boundaries in real time. Kernel-Level Context Propagation: Automatically tracks and correlates distributed trace headers (such as W3C traceparent) across microservice boundaries, gRPC payloads, TLS/SSL streams, and databases (PostgreSQL, Redis, MySQL). Polyglot Uniformity: Works natively across Go, Rust, C/C++, Java, Python, and Node.js without writing distinct SDK wrappers for each stack. 2. The Architectural Win: Eliminating User-Space Overhead Traditional runtime tracing agents introduce memory bloat and garbage collection pauses into production pods. Minimal Footprint: eBPF bytecode executes via the in-kernel JIT compiler with strict safety verifications, sidestepping user-space execution loops. Unified Pipeline: Spans, network round-trip times (RTT), and thread profiling stream straight into standard OpenTelemetry Collector receivers using OpenTelemetry Protocol (OTLP). 3. Where Manual Instrumentation Still Wins OBI does not completely replace application-level code: Business-Logic Spans: Kernel probes observe network hops, I/O latency, and query duration, but they cannot inherently infer domain-specific context (e.g., cart size, checkout flags, or tenant routing IDs). The Hybrid Standard: High-velocity engineering teams use OBI as the baseline fabric for instant cluster-wide visibility, and layer targeted, manual OpenTelemetry API spans only for mission-critical domain logic. Discussion Question Is your organization still manually managing language-specific tracing SDKs in microservice codebases, or have you started testing zero-code eBPF instrumentation in your Kubernetes clusters? CTA Join Techawks General Community: Connect with software architects, cloud engineers, and developers discussing production infrastructure patterns, system design, and emerging engineering tooling. 0 Comments 0 Shares 15 Views 0 Reviews
 -
Tool Review: Inside Claude Code with Prompt Caching — Why Agentic CLI Runtimes Are Replacing Chat IDEs
Agentic workflows have officially moved into your local shell. With the latest wave of developer runtimes like Claude Code, engineers are transitioning from passive autocomplete to autonomous execution loops.
Here is an architectural breakdown of what makes modern CLI agents different, why prompt caching is the critical unlock, and how to structure your development cycle around them:
1. The Core Architecture: Read-Eval-Act Loop
Unlike traditional editor copilots that guess the next token based on open buffer tabs, a CLI agent operates directly inside your local repository using system tools:
Context Ingestion: The agent scans .git, file trees, and AST structures without requiring manual copy-pasting.
Deterministic Execution: It writes patches, runs test suites via pytest/npm test, reads stdout/stderr, and self-heals syntax errors before prompting you for confirmation.
Git Worktree Isolation: High-performing workflows spin up isolated worktrees so agents can experiment, benchmark, and revert regressions without touching your active branch.
2. The Bottleneck It Solves: Context Degradation & Token Cost
Until recently, feeding entire multi-file codebases into an agentic loop was either financially prohibitive or stalled by rate limits.
KV-Cache Hits ($0.20/M tokens): Modern prompt caching keeps 90%+ of repository context frozen in memory. Subsequent tool calls only pay for incremental diffs and output tokens.
Low-Latency Agentic Rounds: Sub-second time-to-first-token (TTFT) on cached context allows the model to perform 5–8 iterative verification loops in under 30 seconds.
3. Best Practices for AI Builders
To get production-grade output from terminal agents:
Define Strict Tool Guardrails: Configure approval flags for destructive bash commands (rm, git push --force, schema migrations).
Standardize Task Spec Files: Feed the agent a concise SPEC.md or acceptance criteria checklist rather than open-ended natural language prompts.
Enforce Test-Driven Prompts: Tell the agent to write a failing integration test first, run it, and iterate until green.
Discussion Question
For your day-to-day engineering, do you prefer autonomous terminal agents executing bash commands, or inline IDE completions where you retain character-level control?
CTA
Join AI Builders & Enthusiasts: Connect with engineers, system architects, and developers shaping the future of autonomous software workflows at Techawks.Tool Review: Inside Claude Code with Prompt Caching — Why Agentic CLI Runtimes Are Replacing Chat IDEs Agentic workflows have officially moved into your local shell. With the latest wave of developer runtimes like Claude Code, engineers are transitioning from passive autocomplete to autonomous execution loops. Here is an architectural breakdown of what makes modern CLI agents different, why prompt caching is the critical unlock, and how to structure your development cycle around them: 1. The Core Architecture: Read-Eval-Act Loop Unlike traditional editor copilots that guess the next token based on open buffer tabs, a CLI agent operates directly inside your local repository using system tools: Context Ingestion: The agent scans .git, file trees, and AST structures without requiring manual copy-pasting. Deterministic Execution: It writes patches, runs test suites via pytest/npm test, reads stdout/stderr, and self-heals syntax errors before prompting you for confirmation. Git Worktree Isolation: High-performing workflows spin up isolated worktrees so agents can experiment, benchmark, and revert regressions without touching your active branch. 2. The Bottleneck It Solves: Context Degradation & Token Cost Until recently, feeding entire multi-file codebases into an agentic loop was either financially prohibitive or stalled by rate limits. KV-Cache Hits ($0.20/M tokens): Modern prompt caching keeps 90%+ of repository context frozen in memory. Subsequent tool calls only pay for incremental diffs and output tokens. Low-Latency Agentic Rounds: Sub-second time-to-first-token (TTFT) on cached context allows the model to perform 5–8 iterative verification loops in under 30 seconds. 3. Best Practices for AI Builders To get production-grade output from terminal agents: Define Strict Tool Guardrails: Configure approval flags for destructive bash commands (rm, git push --force, schema migrations). Standardize Task Spec Files: Feed the agent a concise SPEC.md or acceptance criteria checklist rather than open-ended natural language prompts. Enforce Test-Driven Prompts: Tell the agent to write a failing integration test first, run it, and iterate until green. Discussion Question For your day-to-day engineering, do you prefer autonomous terminal agents executing bash commands, or inline IDE completions where you retain character-level control? CTA Join AI Builders & Enthusiasts: Connect with engineers, system architects, and developers shaping the future of autonomous software workflows at Techawks.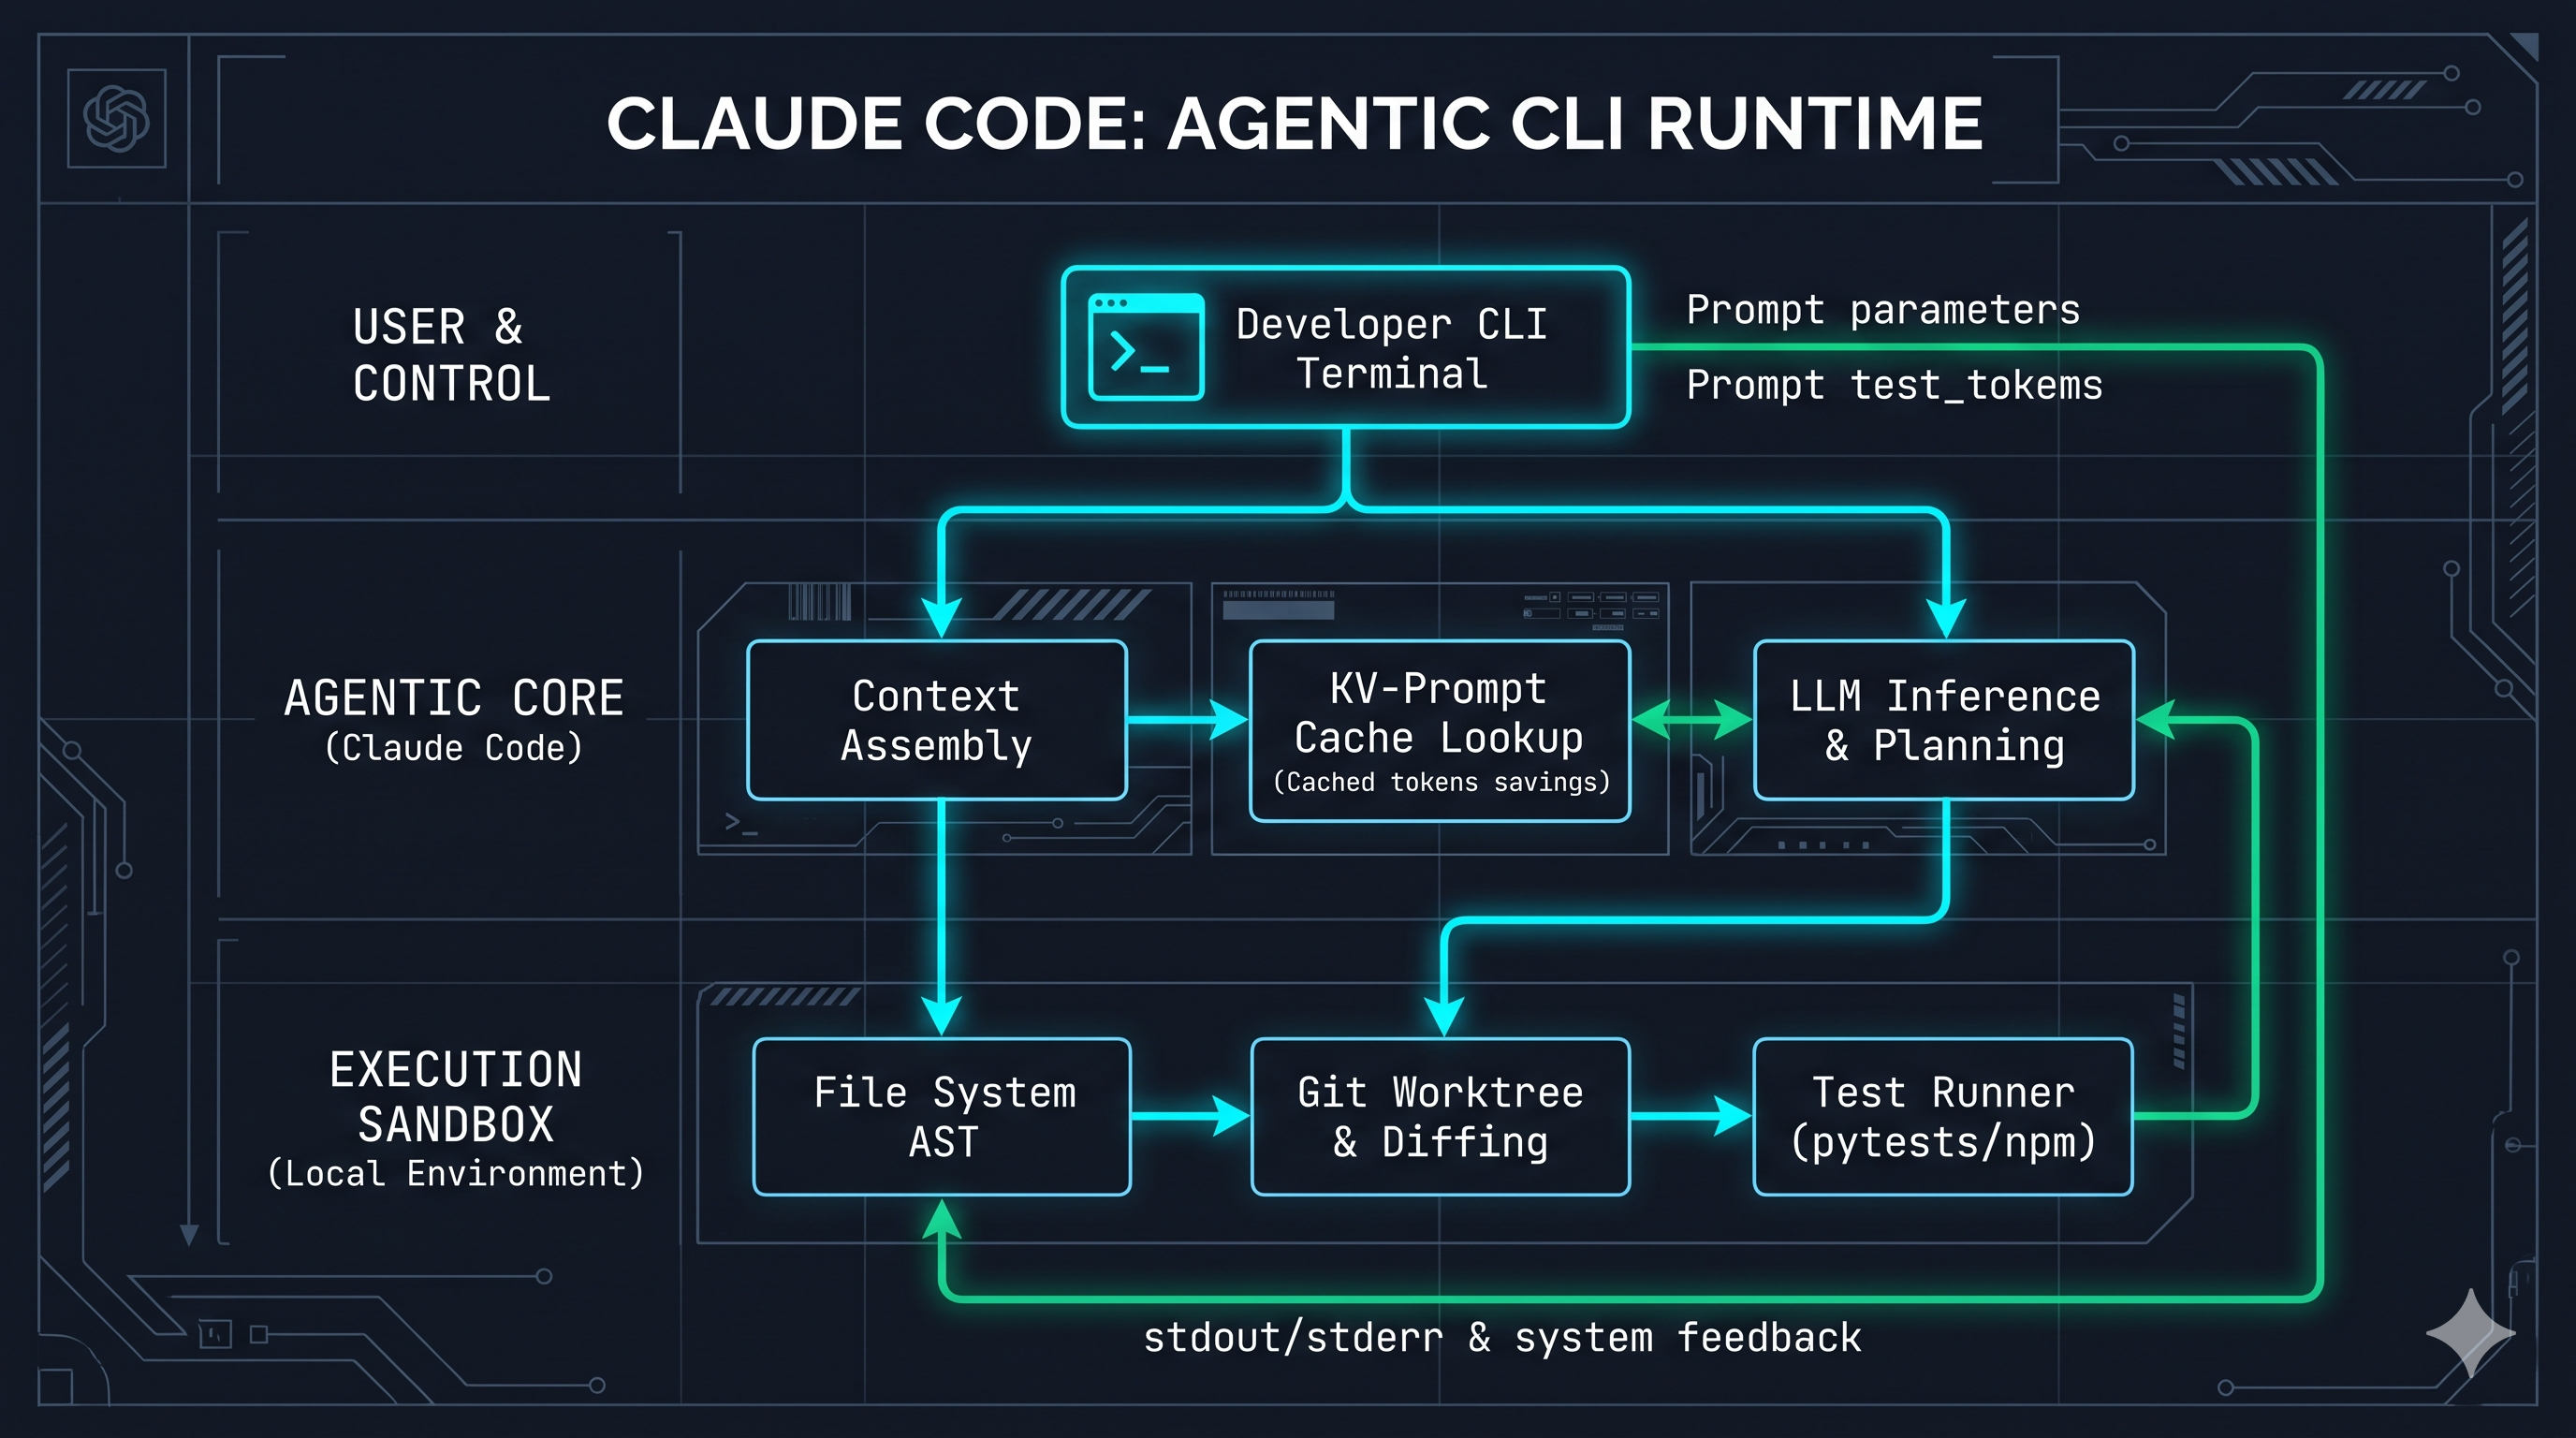 0 Comments 0 Shares 16 Views 0 Reviews
 -
Tool Teardown: Why Advanced TS Codebases Are Ditching Transpilation and Running TypeScript Natively in Production
We spent the past week auditing modern Javascript & TypeScript runtime environments—specifically examining how team architectures are fundamentally changing with standard JS runtimes (like Node.js, Bun, and Deno) introducing native, fast TypeScript execution.
With Node.js having stabilized its --experimental-strip-types and --watch behaviors, alongside Deno 2.x and Bun natively interpreting TypeScript, the era of managing heavy tsc, ts-loader, and complex tsconfig.json build chains just for internal deployment is rapidly ending.
Here is the fundamental systems breakdown:
Systems Architecture: Native In-Memory Strip vs. Legacy Transpilation Build
Plaintext
[ ANTI-PATTERN: LEGACY TRANSPILE-TO-BUILD RUNTIME ]
Source (.ts) ➔ tsc / Build Step ➔ Emit Disk (.js & .map) ➔ Node Engine ➔ Run Disk File ➔ Disk Reads (I/O)
(Slow CI Bottleneck) (Complex Build Config) (Extra Map Debugging) (Runtime Phase) (Disk I/O Overhead)
[ RESILIENT PATTERN: NATIVE RUNTIME (IN-PROCESS TYPE STRIPPING) ]
Source (.ts) ➔ JSR / Node Runtime (Type Stripping) ➔ Native Execution in Memory ➔ Running Process (No Map, No Build Step)
(Zero Dev-Time Wait) (Fast In-Memory Lexing) (Fast SIMD Execution) (Direct Line Debugging)
Why it Matters (The Shift)
Traditionally, running TypeScript meant building a pipeline that converted TypeScript into JavaScript. This required building, writing, and deploying .js assets, configuring complex source maps for debug call stacks, and handling bloated Docker container image layers with build tools and redundant node_modules.
Native execution runtimes remove this middle layer entirely. By adopting fast Rust or Go-based transpilations directly inside the execution engine, standard runtimes run .ts files on the fly. In production environments, Node/Bun/Deno perform a high-speed "type-stripping" pass—discarding annotation tokens instantly with zero type-checking and passing the direct Javascript to V8 or JavaScriptCore. It cuts development feedback loops to zero and slashes CI pipeline build runtimes.
How to Leverage This (Step-by-Step)
Leverage Lightweight Type Stripping (No Checking in Production)
Don't use TypeScript’s heavily resource-intensive compiler tsc to inspect types on production servers. Strip types on the fly.
To run native TypeScript instantly with Node 22.x/23.x+:
Bash
node --experimental-strip-types index.ts
Note: Native runtimes purposely skip type checking for speed. You must run your type checking (tsc --noEmit) as an isolated, asynchronous verification step in your CI lint pipeline, separate from your run-time code.
Migrate to Modern Package Execution
For utility scripts and CLI actions, bypass intermediate generation steps by switching from slow, heavy runners like ts-node or tsnd to native modern alternatives:
Bash
bun run index.ts
# OR
deno run index.ts
Simplify Your Source Map Mapping
When utilizing in-memory parsing, tracking where things break becomes transparent. Avoid multi-step transpile compilation debug chains. If you are using native runtimes, debugging stays 1:1 against your actual .ts source because the runtime handles the in-memory line mapping, eliminating misaligned source-map mapping errors.
Discussion Question
Have you migrated your production or internal tooling workflows to run TypeScript natively through Node’s type stripping, Bun, or Deno? Or are you keeping a deterministic build step to inspect and optimize generated JS before execution? What have been your pipeline and debugging trade-offs?
CTA (Join Developers & Coding)
Want to master modern runtime execution, simplify compilation chains, and write lightning-fast application backends?
👉 Join Developers & Coding to collaborate with senior engineers, break down modern compilers, and build robust software.Tool Teardown: Why Advanced TS Codebases Are Ditching Transpilation and Running TypeScript Natively in Production We spent the past week auditing modern Javascript & TypeScript runtime environments—specifically examining how team architectures are fundamentally changing with standard JS runtimes (like Node.js, Bun, and Deno) introducing native, fast TypeScript execution. With Node.js having stabilized its --experimental-strip-types and --watch behaviors, alongside Deno 2.x and Bun natively interpreting TypeScript, the era of managing heavy tsc, ts-loader, and complex tsconfig.json build chains just for internal deployment is rapidly ending. Here is the fundamental systems breakdown: Systems Architecture: Native In-Memory Strip vs. Legacy Transpilation Build Plaintext [ ANTI-PATTERN: LEGACY TRANSPILE-TO-BUILD RUNTIME ] Source (.ts) ➔ tsc / Build Step ➔ Emit Disk (.js & .map) ➔ Node Engine ➔ Run Disk File ➔ Disk Reads (I/O) (Slow CI Bottleneck) (Complex Build Config) (Extra Map Debugging) (Runtime Phase) (Disk I/O Overhead) [ RESILIENT PATTERN: NATIVE RUNTIME (IN-PROCESS TYPE STRIPPING) ] Source (.ts) ➔ JSR / Node Runtime (Type Stripping) ➔ Native Execution in Memory ➔ Running Process (No Map, No Build Step) (Zero Dev-Time Wait) (Fast In-Memory Lexing) (Fast SIMD Execution) (Direct Line Debugging) Why it Matters (The Shift) Traditionally, running TypeScript meant building a pipeline that converted TypeScript into JavaScript. This required building, writing, and deploying .js assets, configuring complex source maps for debug call stacks, and handling bloated Docker container image layers with build tools and redundant node_modules. Native execution runtimes remove this middle layer entirely. By adopting fast Rust or Go-based transpilations directly inside the execution engine, standard runtimes run .ts files on the fly. In production environments, Node/Bun/Deno perform a high-speed "type-stripping" pass—discarding annotation tokens instantly with zero type-checking and passing the direct Javascript to V8 or JavaScriptCore. It cuts development feedback loops to zero and slashes CI pipeline build runtimes. How to Leverage This (Step-by-Step) Leverage Lightweight Type Stripping (No Checking in Production) Don't use TypeScript’s heavily resource-intensive compiler tsc to inspect types on production servers. Strip types on the fly. To run native TypeScript instantly with Node 22.x/23.x+: Bash node --experimental-strip-types index.ts Note: Native runtimes purposely skip type checking for speed. You must run your type checking (tsc --noEmit) as an isolated, asynchronous verification step in your CI lint pipeline, separate from your run-time code. Migrate to Modern Package Execution For utility scripts and CLI actions, bypass intermediate generation steps by switching from slow, heavy runners like ts-node or tsnd to native modern alternatives: Bash bun run index.ts # OR deno run index.ts Simplify Your Source Map Mapping When utilizing in-memory parsing, tracking where things break becomes transparent. Avoid multi-step transpile compilation debug chains. If you are using native runtimes, debugging stays 1:1 against your actual .ts source because the runtime handles the in-memory line mapping, eliminating misaligned source-map mapping errors. Discussion Question Have you migrated your production or internal tooling workflows to run TypeScript natively through Node’s type stripping, Bun, or Deno? Or are you keeping a deterministic build step to inspect and optimize generated JS before execution? What have been your pipeline and debugging trade-offs? CTA (Join Developers & Coding) Want to master modern runtime execution, simplify compilation chains, and write lightning-fast application backends? 👉 Join Developers & Coding to collaborate with senior engineers, break down modern compilers, and build robust software. 0 Comments 0 Shares 18 Views 0 Reviews
 -
The AI-Assisted Interview: How Top Companies Grade Your Use of Coding Assistants
We spent the past month analyzing modern technical hiring workflows—specifically focusing on how enterprise companies (like Canva, Google, and Zapier) evaluate candidates during "AI-assisted coding" interview loops.
The industry is rapidly shifting. Because access to tools like GitHub Copilot or cursor is now explicitly allowed (and sometimes required) in interviews, hiring managers no longer grade you on your ability to memorize syntax or implement boilerplate algorithms.
Instead, they are assessing Intentional Developer Orchestration.
The fundamental shift in technical interviews breaks down into these critical stages:
Plaintext
[ ANTI-PATTERN: PASSIVE GENERATOR OR "COGNITIVE PASS-OFF" ]
Silent Prompting ➔ Blindy accepting long autocomplete suggestions ➔ Broken code/no tests ➔ Failing code review
(The "Black Box" mistake) (Accepts without debugging) (No understanding) (Cannot explain bugs)
[ RESILIENT PATTERN: THE ACTIVE DEVELOPER-ORCHESTRATOR ]
Define Boundaries ➔ Scaffold & Chunk ➔ Evaluate & Critique ➔ Assert Control
(Talk through logic) (Iterative prompting) (Review edge cases) (Explain trade-offs)
Here is exactly how top-tier teams evaluate candidates using AI in 2026—and how you can stand out:
1. Requirements Scaffolding over "Magic Prompting"
Before touch is put to the keyboard, engineers look at how you approach the problem. Starting with a 15-line natural language block and asking the assistant to "build the entire feature" is a major red flag.
The Smart Pattern: Break the problem down into components. Define input/output contracts, identify edge cases (like handling empty payloads or high-volume rates), and outline your architectural approach verbally with the interviewer before prompting the model.
2. Skeptical Acceptance over Unchecked Speed
The fastest candidates are often the quickest to fail. Interviewers track how closely you verify the AI's suggestions. Accepting large auto-completed code blocks without verifying constraints, variable scopes, or edge cases shows a lack of technical oversight.
The Smart Pattern: Treat generative code like code submitted by a junior engineer. Review everything. Check for missing safety boundaries, validation, or redundant operations. If the assistant produces an overly complex solution, reject it and explain why a simpler, linear implementation is better.
3. Iterative Testing and Debugging
A major failure mode during these interviews is "generate, crash, guess-prompt, repeat." Throwing a failing error back to the AI without trying to read or identify the stack trace yourself highlights a lack of debugging skills.
The Smart Pattern: Write unit tests early. Use the tool to quickly populate test suites and edge-case arrays. When a bug appears, inspect the memory state or trace the variable yourself first, explain where the fault lies to the interviewer, and use the assistant targetedly to write the fix.
4. Post-Generation Architecture & Critique
A generation that passes the test suite is only 50% of the grade. Modern interviews prioritize the "Post-Build Review."
The Smart Pattern: Analyze the generated code aloud. Explain your technical choices, point out parts you would optimize or scale in a production environment, and compare alternatives (e.g., memory usage versus compute speed). Showing that you understand the "why" proves you are the engineer, not just the prompt driver.
Discussion Question
Have you participated in an interview that allowed or included AI coding assistants? How did you strike the right balance between using the assistant's speed and demonstrating your own problem-solving ability to the interviewer?
CTA (Join Tech Jobs & Opportunities)
Want to master modern interview paradigms, deconstruct complex systems, and connect with engineering teams at the forefront of hiring?
👉 Join Tech Jobs & Opportunities to align with mentors, prepare for AI-era loops, and find your next breakthrough role.The AI-Assisted Interview: How Top Companies Grade Your Use of Coding Assistants We spent the past month analyzing modern technical hiring workflows—specifically focusing on how enterprise companies (like Canva, Google, and Zapier) evaluate candidates during "AI-assisted coding" interview loops. The industry is rapidly shifting. Because access to tools like GitHub Copilot or cursor is now explicitly allowed (and sometimes required) in interviews, hiring managers no longer grade you on your ability to memorize syntax or implement boilerplate algorithms. Instead, they are assessing Intentional Developer Orchestration. The fundamental shift in technical interviews breaks down into these critical stages: Plaintext [ ANTI-PATTERN: PASSIVE GENERATOR OR "COGNITIVE PASS-OFF" ] Silent Prompting ➔ Blindy accepting long autocomplete suggestions ➔ Broken code/no tests ➔ Failing code review (The "Black Box" mistake) (Accepts without debugging) (No understanding) (Cannot explain bugs) [ RESILIENT PATTERN: THE ACTIVE DEVELOPER-ORCHESTRATOR ] Define Boundaries ➔ Scaffold & Chunk ➔ Evaluate & Critique ➔ Assert Control (Talk through logic) (Iterative prompting) (Review edge cases) (Explain trade-offs) Here is exactly how top-tier teams evaluate candidates using AI in 2026—and how you can stand out: 1. Requirements Scaffolding over "Magic Prompting" Before touch is put to the keyboard, engineers look at how you approach the problem. Starting with a 15-line natural language block and asking the assistant to "build the entire feature" is a major red flag. The Smart Pattern: Break the problem down into components. Define input/output contracts, identify edge cases (like handling empty payloads or high-volume rates), and outline your architectural approach verbally with the interviewer before prompting the model. 2. Skeptical Acceptance over Unchecked Speed The fastest candidates are often the quickest to fail. Interviewers track how closely you verify the AI's suggestions. Accepting large auto-completed code blocks without verifying constraints, variable scopes, or edge cases shows a lack of technical oversight. The Smart Pattern: Treat generative code like code submitted by a junior engineer. Review everything. Check for missing safety boundaries, validation, or redundant operations. If the assistant produces an overly complex solution, reject it and explain why a simpler, linear implementation is better. 3. Iterative Testing and Debugging A major failure mode during these interviews is "generate, crash, guess-prompt, repeat." Throwing a failing error back to the AI without trying to read or identify the stack trace yourself highlights a lack of debugging skills. The Smart Pattern: Write unit tests early. Use the tool to quickly populate test suites and edge-case arrays. When a bug appears, inspect the memory state or trace the variable yourself first, explain where the fault lies to the interviewer, and use the assistant targetedly to write the fix. 4. Post-Generation Architecture & Critique A generation that passes the test suite is only 50% of the grade. Modern interviews prioritize the "Post-Build Review." The Smart Pattern: Analyze the generated code aloud. Explain your technical choices, point out parts you would optimize or scale in a production environment, and compare alternatives (e.g., memory usage versus compute speed). Showing that you understand the "why" proves you are the engineer, not just the prompt driver. Discussion Question Have you participated in an interview that allowed or included AI coding assistants? How did you strike the right balance between using the assistant's speed and demonstrating your own problem-solving ability to the interviewer? CTA (Join Tech Jobs & Opportunities) Want to master modern interview paradigms, deconstruct complex systems, and connect with engineering teams at the forefront of hiring? 👉 Join Tech Jobs & Opportunities to align with mentors, prepare for AI-era loops, and find your next breakthrough role. 0 Comments 0 Shares 19 Views 0 Reviews
 -
Tool Teardown: Why Early-Stage Founders Are Ditching Enterprise Cloud PaaS for Self-Hosted Engines (Coolify)
Founders frequently fall into a costly architectural trap: offloading early deployment to high-markup proprietary PaaS providers (Heroku, Render, AWS managed services) for the sake of "developer velocity."
Within six months, the trap snaps shut:
Compute and memory scale at steep non-linear price markups.
Ephemeral preview environments add hidden costs per pull request.
Staging, staging databases, and cache layers multiply baseline operational burn.
The emerging consensus among lean engineering teams is self-hosted PaaS control planes—most prominently Coolify. Running on top of bare-metal VPS providers (Hetzner, OVH, or raw EC2), self-hosted engines deliver the full developer experience of managed platforms without the 5x infrastructure markup.
Systems Architecture: Proprietary Managed PaaS vs. Self-Hosted Control Plane
Plaintext
[ ANTI-PATTERN: HIGH-MARKUP MULTI-TENANT MANAGED PAAS ]
Git Push ---> Proprietary Build System ---> Locked Egress/Add-on Routing ---> $800+/mo SaaS Invoices
(Local Repo) (Opaque CI Minutes) (Multiplied DB/Cache Tiers) (Seed Runway Drain)
[ RESILIENT PATTERN: SELF-HOSTED OPEN CONTROL PLANE (COOLIFY) ]
Git Push ---> Traefik Reverse Proxy ---> Docker/Nixpacks Container Cluster ---> Flat $40/mo Compute VPS
(GitHub Webhook) (Auto-SSL / SNI Routing) (Postgres + Redis + App Co-located) (Full Data Ownership)
Production-Grade Evaluation: Why Lean Startups Should Care
Uncapped Co-Location Economics
Managed providers bill separately—and aggressively—for every background worker, Redis instance, and cron trigger. A single $40/month bare-metal instance (16GB RAM, 8 vCPUs) running a self-hosted engine can host your primary API, web frontend, Redis cache, and PostgreSQL database with near-zero latency inter-container networking.
Automated Nixpacks & Docker Build Orchestration
Modern self-hosted tooling eliminates manual server administration. By leveraging Nixpacks and buildpacks, the system automatically detects languages, installs runtimes, handles zero-downtime rolling deployments, and auto-provisions Let's Encrypt SSL certificates via Traefik reverse proxies.
No Vendor Lock-In & Portable Disaster Recovery
Proprietary PaaS systems obscure configuration logic behind dashboard toggles. Self-hosted platforms store service topology, environment secrets, and volumes as standardized Docker Compose configurations. If you ever need to migrate providers, you transfer standard Docker containers rather than refactoring cloud-specific infrastructure manifests.
The Boundary Constraint: When to Graduate
Self-hosted single-box setups are ideal from day zero up to $50k+ MRR. You only graduate to managed Kubernetes (EKS/GKE) or specialized multi-region cloud tiers when your team has dedicated platform engineering staff and regulatory compliance demands (SOC 2 Type II, multi-region failover, distributed write replication) that justify the overhead.
Discussion Question
What is your startup's current infrastructure burn rate? At what ARR or traffic threshold do you consider migrating from simple VPS/self-hosted setups to complex managed cloud clusters?
CTA (Join Startup Founders & Entrepreneurs)
Want to optimize your engineering runway, validate tech stacks, and scale your product without draining investor capital?
👉 Join Startup Founders & Entrepreneurs to collaborate with fellow technical founders and CTOs building high-efficiency startups.Tool Teardown: Why Early-Stage Founders Are Ditching Enterprise Cloud PaaS for Self-Hosted Engines (Coolify) Founders frequently fall into a costly architectural trap: offloading early deployment to high-markup proprietary PaaS providers (Heroku, Render, AWS managed services) for the sake of "developer velocity." Within six months, the trap snaps shut: Compute and memory scale at steep non-linear price markups. Ephemeral preview environments add hidden costs per pull request. Staging, staging databases, and cache layers multiply baseline operational burn. The emerging consensus among lean engineering teams is self-hosted PaaS control planes—most prominently Coolify. Running on top of bare-metal VPS providers (Hetzner, OVH, or raw EC2), self-hosted engines deliver the full developer experience of managed platforms without the 5x infrastructure markup. Systems Architecture: Proprietary Managed PaaS vs. Self-Hosted Control Plane Plaintext [ ANTI-PATTERN: HIGH-MARKUP MULTI-TENANT MANAGED PAAS ] Git Push ---> Proprietary Build System ---> Locked Egress/Add-on Routing ---> $800+/mo SaaS Invoices (Local Repo) (Opaque CI Minutes) (Multiplied DB/Cache Tiers) (Seed Runway Drain) [ RESILIENT PATTERN: SELF-HOSTED OPEN CONTROL PLANE (COOLIFY) ] Git Push ---> Traefik Reverse Proxy ---> Docker/Nixpacks Container Cluster ---> Flat $40/mo Compute VPS (GitHub Webhook) (Auto-SSL / SNI Routing) (Postgres + Redis + App Co-located) (Full Data Ownership) Production-Grade Evaluation: Why Lean Startups Should Care Uncapped Co-Location Economics Managed providers bill separately—and aggressively—for every background worker, Redis instance, and cron trigger. A single $40/month bare-metal instance (16GB RAM, 8 vCPUs) running a self-hosted engine can host your primary API, web frontend, Redis cache, and PostgreSQL database with near-zero latency inter-container networking. Automated Nixpacks & Docker Build Orchestration Modern self-hosted tooling eliminates manual server administration. By leveraging Nixpacks and buildpacks, the system automatically detects languages, installs runtimes, handles zero-downtime rolling deployments, and auto-provisions Let's Encrypt SSL certificates via Traefik reverse proxies. No Vendor Lock-In & Portable Disaster Recovery Proprietary PaaS systems obscure configuration logic behind dashboard toggles. Self-hosted platforms store service topology, environment secrets, and volumes as standardized Docker Compose configurations. If you ever need to migrate providers, you transfer standard Docker containers rather than refactoring cloud-specific infrastructure manifests. The Boundary Constraint: When to Graduate Self-hosted single-box setups are ideal from day zero up to $50k+ MRR. You only graduate to managed Kubernetes (EKS/GKE) or specialized multi-region cloud tiers when your team has dedicated platform engineering staff and regulatory compliance demands (SOC 2 Type II, multi-region failover, distributed write replication) that justify the overhead. Discussion Question What is your startup's current infrastructure burn rate? At what ARR or traffic threshold do you consider migrating from simple VPS/self-hosted setups to complex managed cloud clusters? CTA (Join Startup Founders & Entrepreneurs) Want to optimize your engineering runway, validate tech stacks, and scale your product without draining investor capital? 👉 Join Startup Founders & Entrepreneurs to collaborate with fellow technical founders and CTOs building high-efficiency startups.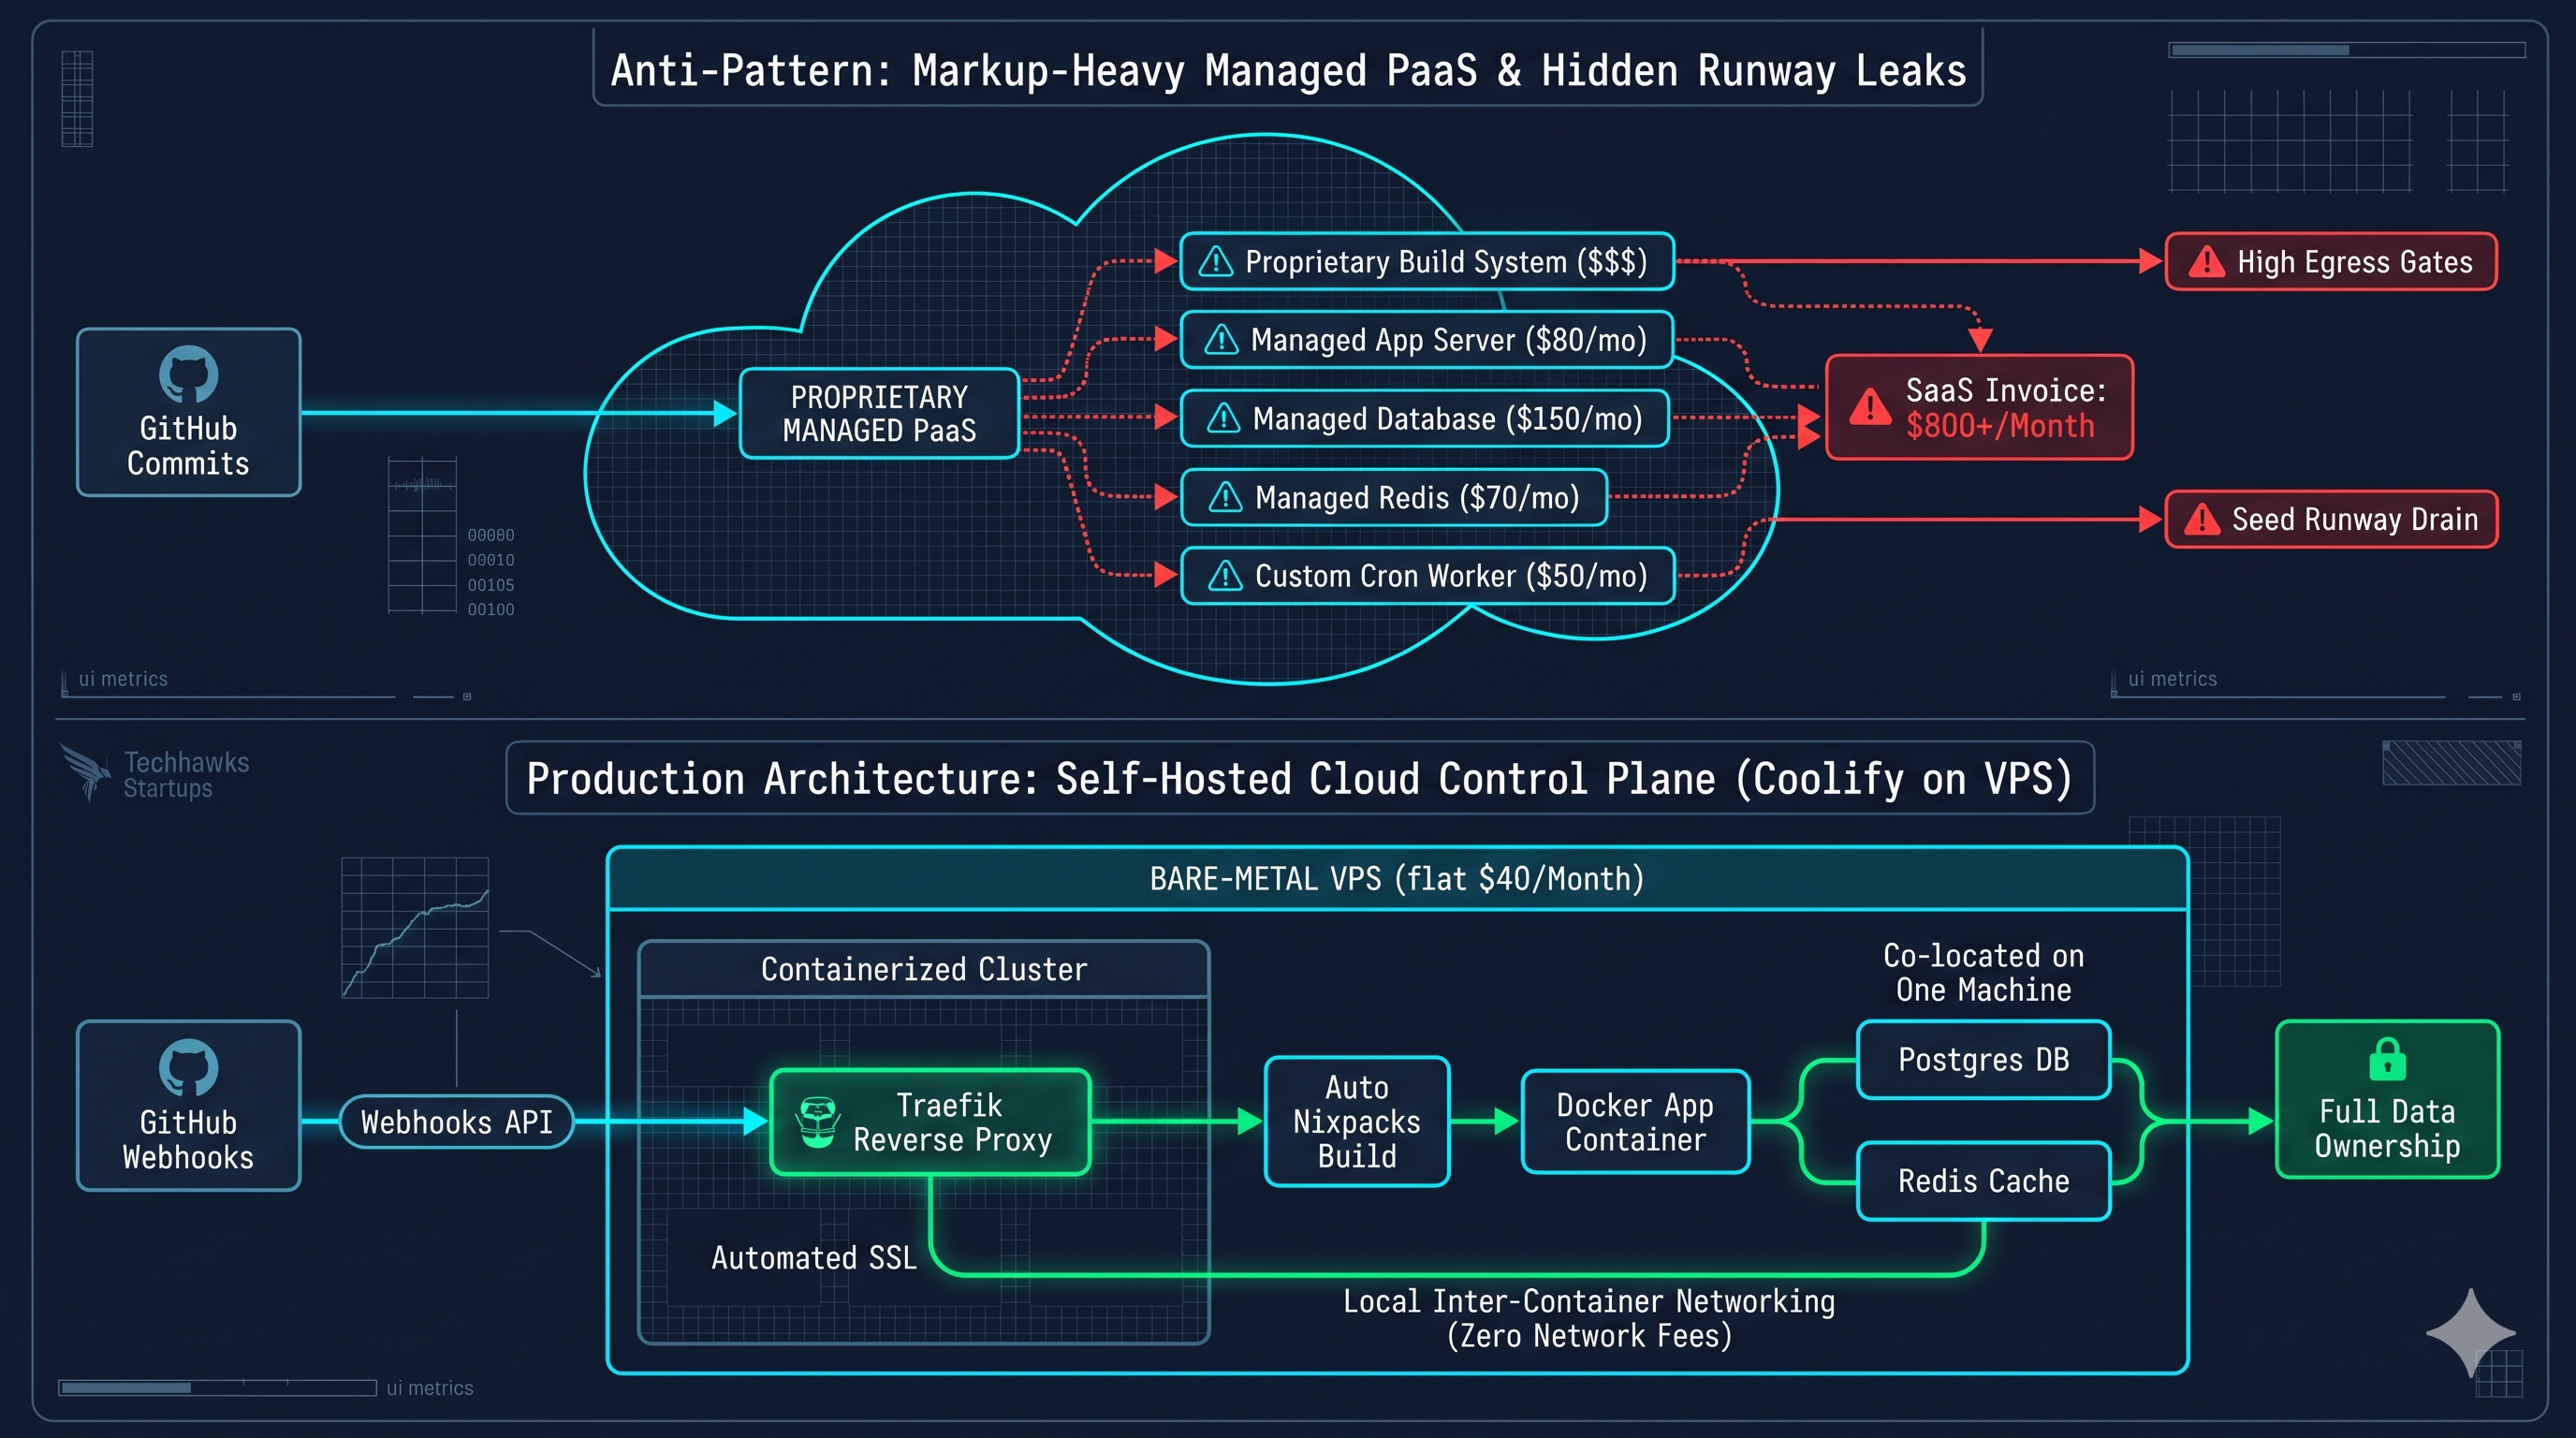 0 Comments 0 Shares 19 Views 0 Reviews
 -
Tool Teardown: Why Reactive Notebooks (Marimo) Are Replacing Jupyter for Engineering Students
Most computer science and data students start their coding journey in classic Jupyter notebooks. But traditional notebooks teach an anti-pattern: linear cell ordering with mutable global state.
When you delete a variable or run cell 4 before cell 2, the kernel remembers what you did, masking silent logic bugs until grading time. When you collaborate via Git, opaque .ipynb JSON diffs trigger merge nightmares.
The modern industry and educational shift has landed on Marimo—a reactive Python notebook stored entirely as pure Python scripts.
Systems Architecture: Linear State Leaks vs. Reactive DAG Execution
Plaintext
[ ANTI-PATTERN: OUT-OF-ORDER JUPYTER KERNEL MUTATION ]
Cell 1 (df = load()) ---> Cell 3 (df = filter(df)) ---> Cell 2 (df.describe()) ---> Hidden State Leak
(Executed 1st) (Executed 3rd / Modifies Global) (Executed 2nd / Stale View) (Non-Reproducible Runtime)
[ RESILIENT PATTERN: MARIMO REACTIVE DIRECTED ACYCLIC GRAPH (DAG) ]
User Input / Variable Change ---> AST Parsing ---> Dependency Graph (DAG) ---> Automatic Reactive Cascading
(Slider, Code Edit) (Pure Python Script) (Zero Hidden Cells) (Guaranteed Deterministic State)
Production-Grade Evaluation: Why Students Must Level Up
Reactivity Enforces True Functional Thinking
In Marimo, cells are nodes in a Directed Acyclic Graph (DAG). If Cell B relies on variable x created in Cell A, changing x automatically re-runs Cell B. If you define the same variable in two separate cells, Marimo refuses to execute, forcing you to design clean, non-conflicting variable scopes just like production software.
Git-Native Storage as Pure .py Files
Classic notebooks save outputs, binary images, and metadata in bloated JSON payloads. Marimo files are standard Python files (app.py). You can run git diff cleanly, conduct readable peer pull requests, and lint your assignments with tools like Ruff or Flake8 without workarounds.
Built-in Package Reproducibility via Inline Metadata
Instead of wrestling with broken local environments or manually writing messy requirements.txt files, modern reactive workflows integrate directly with fast package managers like uv. Dependencies are declared directly inside the script header via PEP 723 metadata, allowing classmates and instructors to run your project reproducibly with zero environment drift.
Zero-Friction Conversion from Exploration to Interactive Web Apps
With traditional workflows, converting research scripts into an interactive demo requires rewriting code into Streamlit or Dash. Running marimo run notebook.py immediately serves your code as an isolated, interactive web application with reactive UI sliders and input fields ready for project showcases.
Discussion Question
Have you ever lost marks or wasted hours because a notebook ran smoothly on your laptop but failed when an instructor or teammate ran "Restart & Run All"? How does your university or study group manage notebook version control?
CTA (Join Students in Tech)
Ready to build production-grade development habits, master modern tooling, and stand out in software engineering interviews?
👉 Join Students in Tech to connect with fellow student developers, open-source contributors, and industry mentors.Tool Teardown: Why Reactive Notebooks (Marimo) Are Replacing Jupyter for Engineering Students Most computer science and data students start their coding journey in classic Jupyter notebooks. But traditional notebooks teach an anti-pattern: linear cell ordering with mutable global state. When you delete a variable or run cell 4 before cell 2, the kernel remembers what you did, masking silent logic bugs until grading time. When you collaborate via Git, opaque .ipynb JSON diffs trigger merge nightmares. The modern industry and educational shift has landed on Marimo—a reactive Python notebook stored entirely as pure Python scripts. Systems Architecture: Linear State Leaks vs. Reactive DAG Execution Plaintext [ ANTI-PATTERN: OUT-OF-ORDER JUPYTER KERNEL MUTATION ] Cell 1 (df = load()) ---> Cell 3 (df = filter(df)) ---> Cell 2 (df.describe()) ---> Hidden State Leak (Executed 1st) (Executed 3rd / Modifies Global) (Executed 2nd / Stale View) (Non-Reproducible Runtime) [ RESILIENT PATTERN: MARIMO REACTIVE DIRECTED ACYCLIC GRAPH (DAG) ] User Input / Variable Change ---> AST Parsing ---> Dependency Graph (DAG) ---> Automatic Reactive Cascading (Slider, Code Edit) (Pure Python Script) (Zero Hidden Cells) (Guaranteed Deterministic State) Production-Grade Evaluation: Why Students Must Level Up Reactivity Enforces True Functional Thinking In Marimo, cells are nodes in a Directed Acyclic Graph (DAG). If Cell B relies on variable x created in Cell A, changing x automatically re-runs Cell B. If you define the same variable in two separate cells, Marimo refuses to execute, forcing you to design clean, non-conflicting variable scopes just like production software. Git-Native Storage as Pure .py Files Classic notebooks save outputs, binary images, and metadata in bloated JSON payloads. Marimo files are standard Python files (app.py). You can run git diff cleanly, conduct readable peer pull requests, and lint your assignments with tools like Ruff or Flake8 without workarounds. Built-in Package Reproducibility via Inline Metadata Instead of wrestling with broken local environments or manually writing messy requirements.txt files, modern reactive workflows integrate directly with fast package managers like uv. Dependencies are declared directly inside the script header via PEP 723 metadata, allowing classmates and instructors to run your project reproducibly with zero environment drift. Zero-Friction Conversion from Exploration to Interactive Web Apps With traditional workflows, converting research scripts into an interactive demo requires rewriting code into Streamlit or Dash. Running marimo run notebook.py immediately serves your code as an isolated, interactive web application with reactive UI sliders and input fields ready for project showcases. Discussion Question Have you ever lost marks or wasted hours because a notebook ran smoothly on your laptop but failed when an instructor or teammate ran "Restart & Run All"? How does your university or study group manage notebook version control? CTA (Join Students in Tech) Ready to build production-grade development habits, master modern tooling, and stand out in software engineering interviews? 👉 Join Students in Tech to connect with fellow student developers, open-source contributors, and industry mentors. 0 Comments 0 Shares 19 Views 0 Reviews
More Stories

 Arabic
 French
 Spanish
 Portuguese
 Deutsch
 Turkish
 Dutch
Dutch
 Italiano
 Russian
 Romaian
 Portuguese (Brazil)
 Greek
Greek