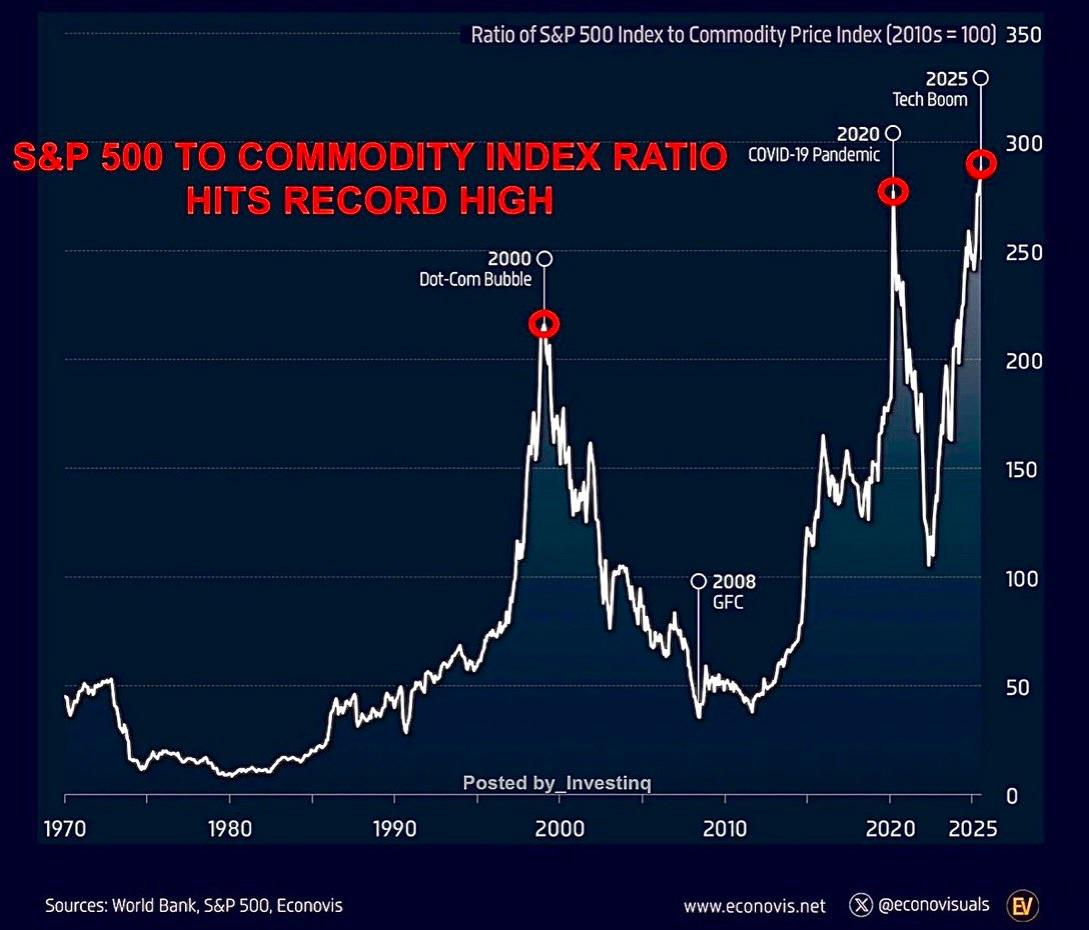
The S&P 500 to Commodity Index ratio has just hit an all-time high surpassing even the peaks of the Dot-Com Bubble and the 2020 surge.
Every spike in this chart tells a story:
2000 was tech euphoria.
2008 was the global financial crisis aftermath.
2020 was extremes.
And now, 2025 another tech-fuelled boom pushing equities far ahead of real assets.
Whenever this ratio stretches too far, history suggests a rebalancing between financial assets and hard commodities isn’t far behind.
#SP500 #Commodities #Markets #Investing #Finance #StockMarket #Macro #Economy #Wealth #FinancialMarkets #Inflation #Assets
The S&P 500 to Commodity Index ratio has just hit an all-time high surpassing even the peaks of the Dot-Com Bubble and the 2020 surge.
Every spike in this chart tells a story:
2000 was tech euphoria.
2008 was the global financial crisis aftermath.
2020 was extremes.
And now, 2025 another tech-fuelled boom pushing equities far ahead of real assets.
Whenever this ratio stretches too far, history suggests a rebalancing between financial assets and hard commodities isn’t far behind.
#SP500 #Commodities #Markets #Investing #Finance #StockMarket #Macro #Economy #Wealth #FinancialMarkets #Inflation #Assets
·338 Views
·0 Reviews