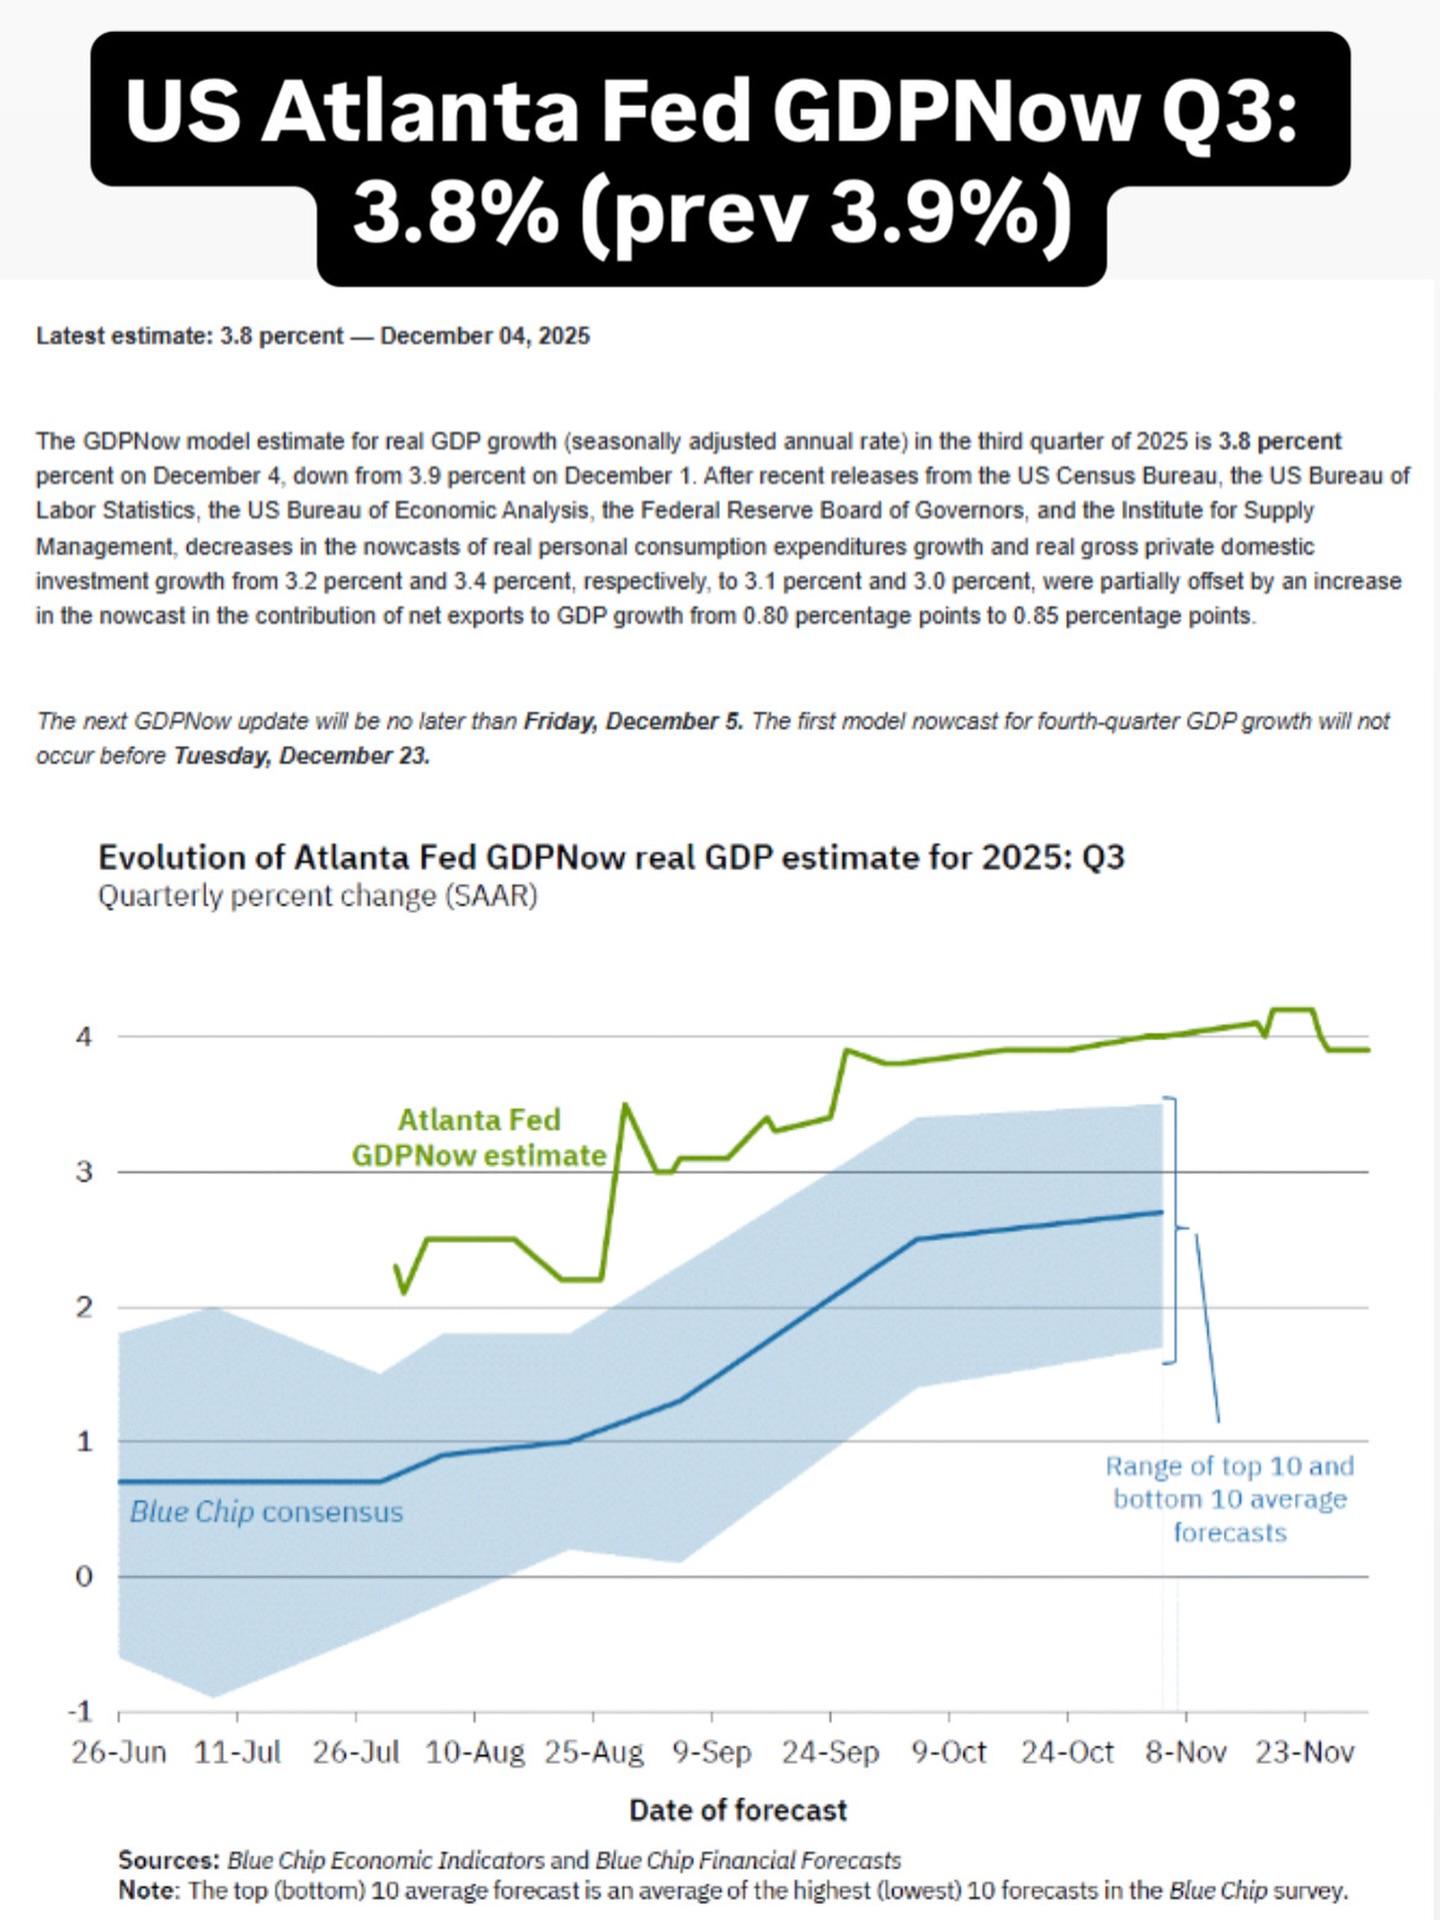
The Atlanta Fed just revised its GDPNow estimate for Q3 down slightly from 3.9% to 3.8%. Still strong, still above trend, and still well above what most forecasters expected just a few months ago.
But here’s the interesting part:
While the US economy continues to outperform expectations, other major economies are showing cracks:
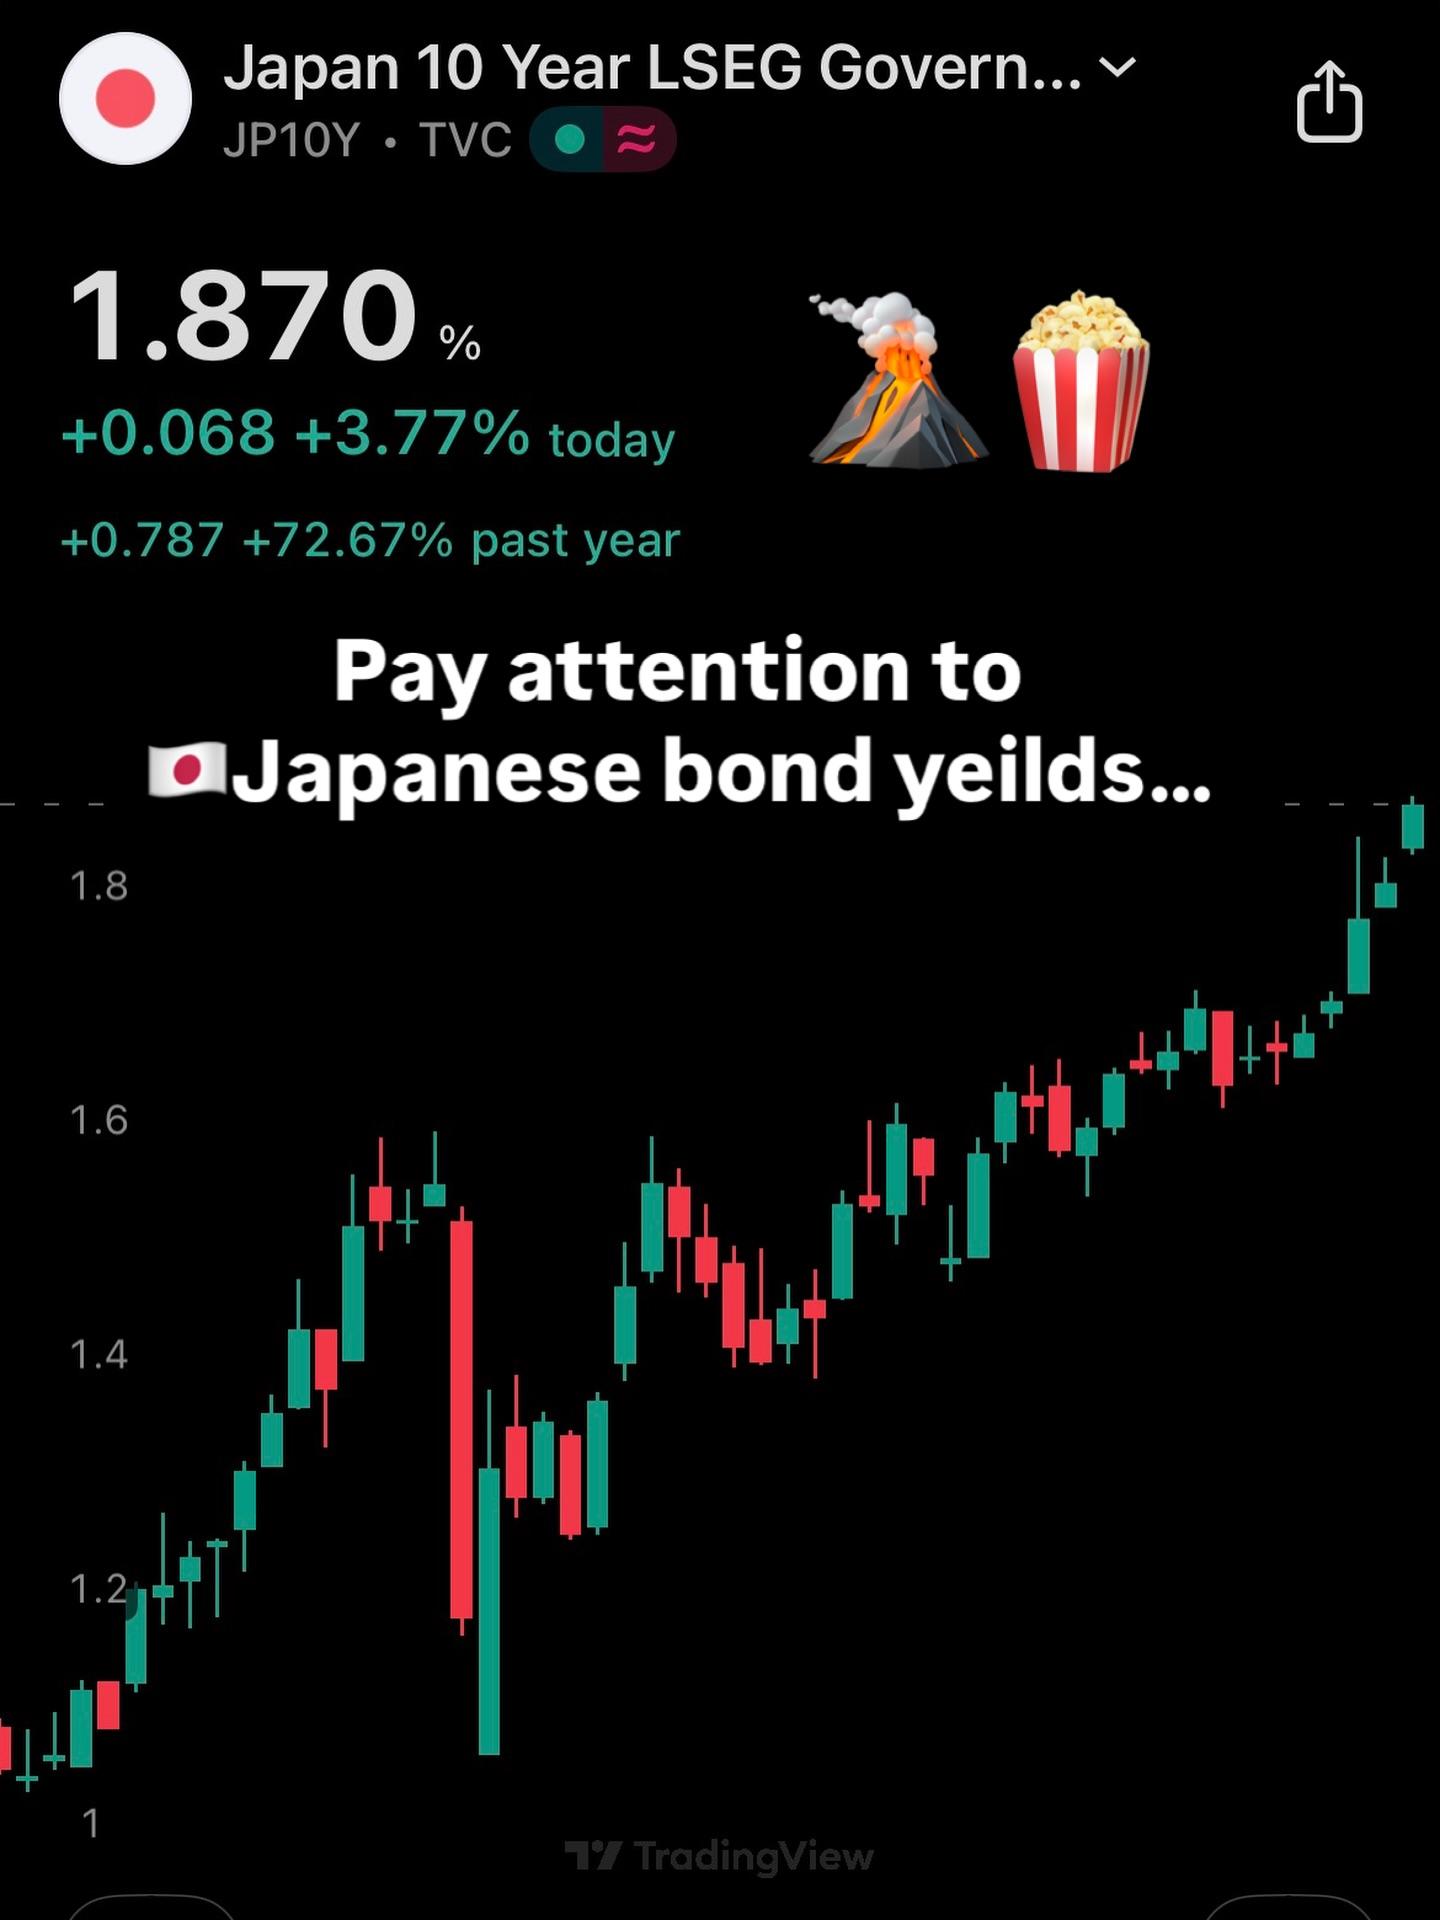
Japan is wrestling with rising bond yields and the limits of yield curve control.
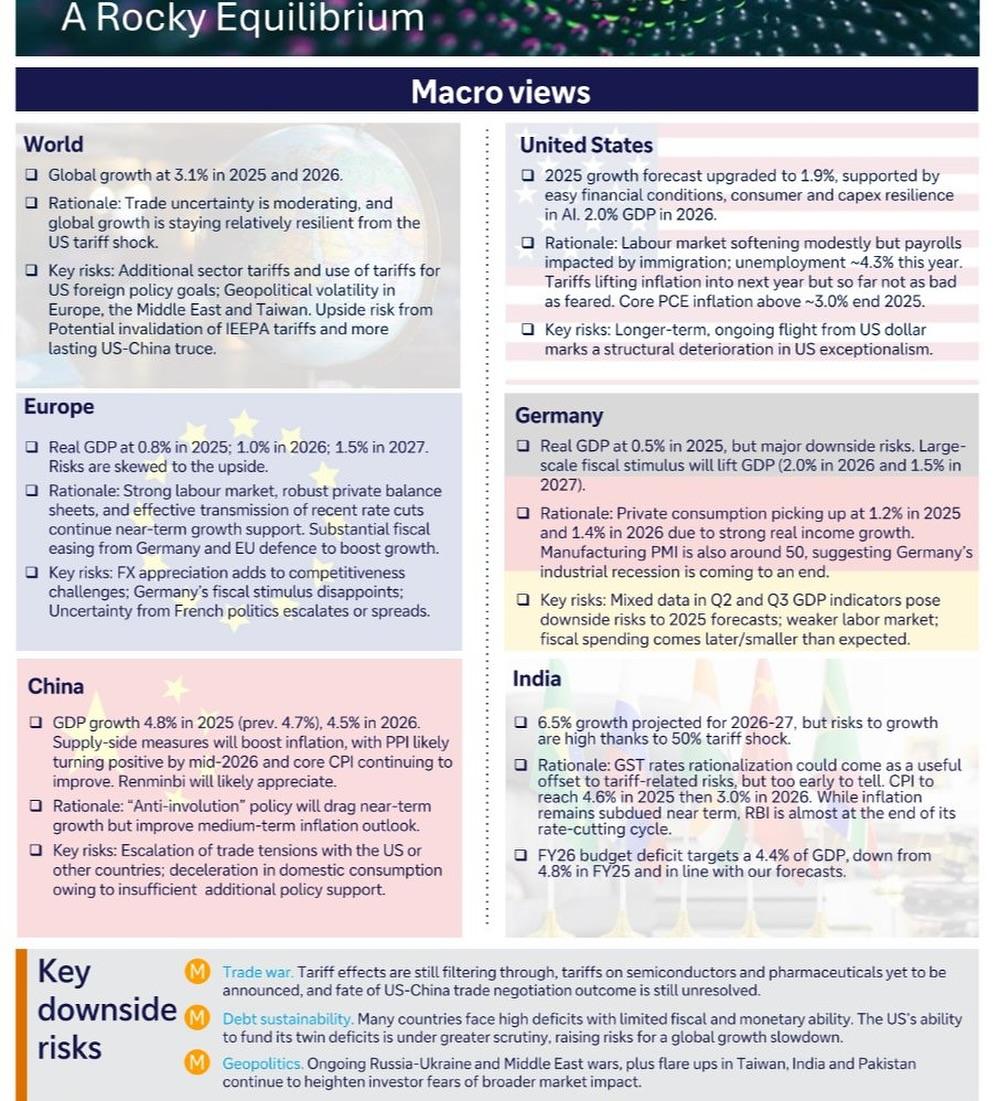
Europe is stagnating.
China is fighting deflationary pressure and structural debt issues.
Meanwhile, US growth remains resilient driven by consumer spending, investment, and ongoing fiscal momentum.
A number like 3.8% doesn’t sound dramatic, but in a world of slowing growth, this level of momentum makes a statement. The US continues to be the global outlier the economy everyone bets against, yet the one capital keeps flowing back to.
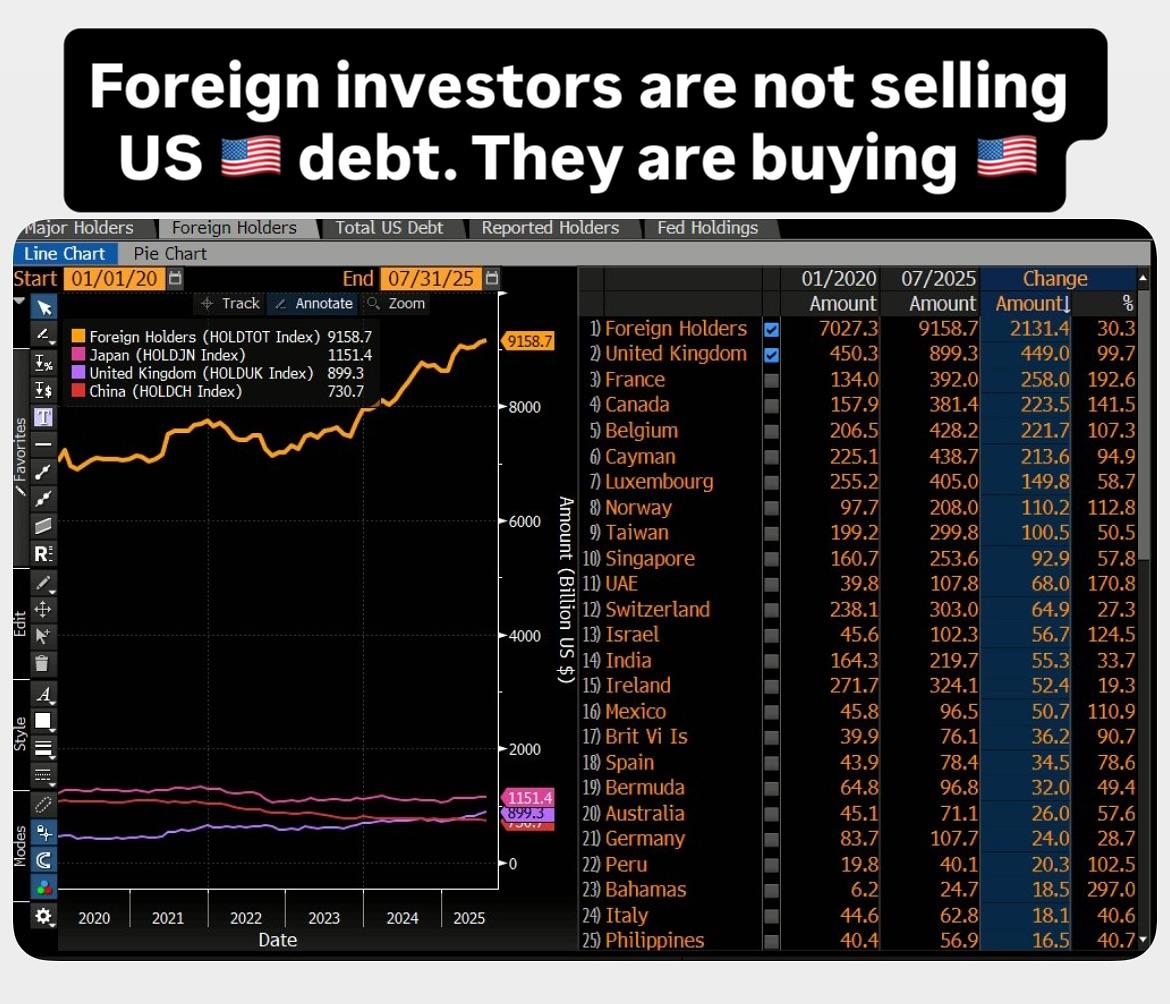
No wonder global investors overweight US equities and Treasuries. The U.S. isn’t just participating in the global cycle it’s defining it.
The real question:
Does this strength give the Fed room to stay tighter for longer, or does it simply delay the slowdown the market keeps trying to price in?
Because if the economy really is this strong rate cuts aren’t a certainty. They become a negotiation.
#GDP #Economy #Macro #AtlantaFed #Growth #Finance #Markets #USMarket #Investing #RecessionNarrative #DataDriven
But here’s the interesting part:
While the US economy continues to outperform expectations, other major economies are showing cracks:
Japan is wrestling with rising bond yields and the limits of yield curve control.
Europe is stagnating.
China is fighting deflationary pressure and structural debt issues.
Meanwhile, US growth remains resilient driven by consumer spending, investment, and ongoing fiscal momentum.
A number like 3.8% doesn’t sound dramatic, but in a world of slowing growth, this level of momentum makes a statement. The US continues to be the global outlier the economy everyone bets against, yet the one capital keeps flowing back to.
No wonder global investors overweight US equities and Treasuries. The U.S. isn’t just participating in the global cycle it’s defining it.
The real question:
Does this strength give the Fed room to stay tighter for longer, or does it simply delay the slowdown the market keeps trying to price in?
Because if the economy really is this strong rate cuts aren’t a certainty. They become a negotiation.
#GDP #Economy #Macro #AtlantaFed #Growth #Finance #Markets #USMarket #Investing #RecessionNarrative #DataDriven
The Atlanta Fed just revised its GDPNow estimate for Q3 down slightly from 3.9% to 3.8%. Still strong, still above trend, and still well above what most forecasters expected just a few months ago.
But here’s the interesting part:
While the US economy continues to outperform expectations, other major economies are showing cracks:
Japan is wrestling with rising bond yields and the limits of yield curve control.
Europe is stagnating.
China is fighting deflationary pressure and structural debt issues.
Meanwhile, US growth remains resilient driven by consumer spending, investment, and ongoing fiscal momentum.
A number like 3.8% doesn’t sound dramatic, but in a world of slowing growth, this level of momentum makes a statement. The US continues to be the global outlier the economy everyone bets against, yet the one capital keeps flowing back to.
No wonder global investors overweight US equities and Treasuries. The U.S. isn’t just participating in the global cycle it’s defining it.
The real question:
Does this strength give the Fed room to stay tighter for longer, or does it simply delay the slowdown the market keeps trying to price in?
Because if the economy really is this strong rate cuts aren’t a certainty. They become a negotiation.
#GDP #Economy #Macro #AtlantaFed #Growth #Finance #Markets #USMarket #Investing #RecessionNarrative #DataDriven
·135 مشاهدة
·0 معاينة