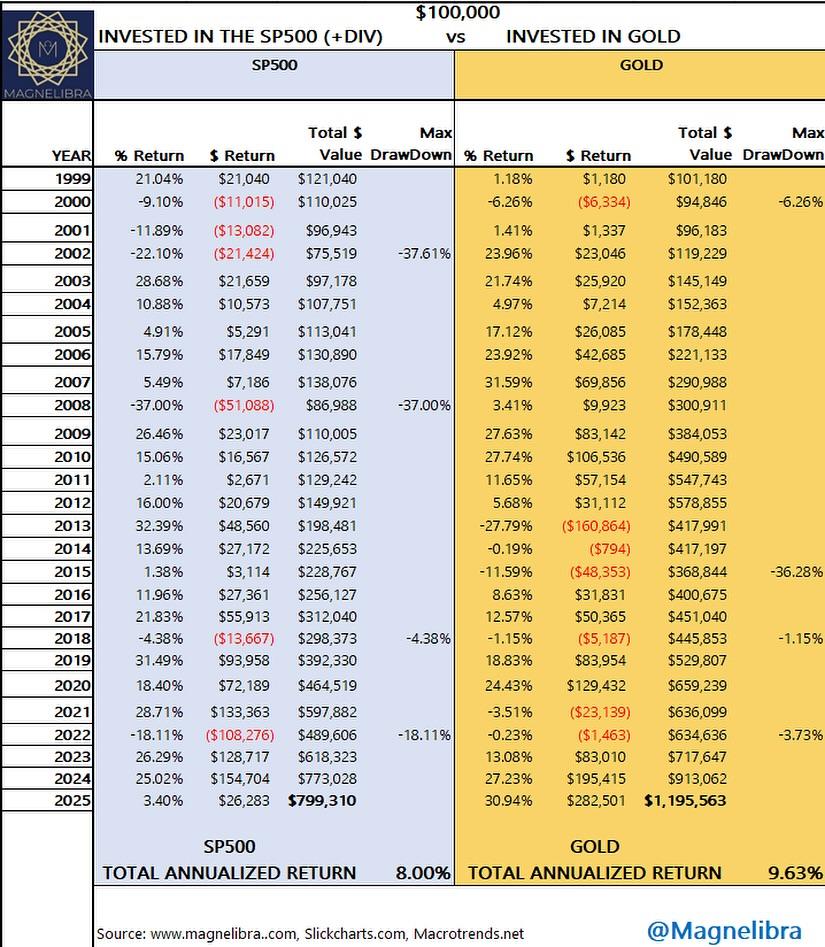
This chart flips a long-standing market narrative on its head. Over the past 25+ years, gold has significantly outperformed the S&P 500 delivering a total annualized return of 9.63%, compared to just 8.00% for the S&P 500 (including dividends). Starting from $100,000 in 1999, a gold investor would now be sitting on nearly $1.2 million, while the same investment in the S&P 500 would be just under $800k.
It’s a striking reminder that asset allocation matters and that sometimes the best-performing asset isn’t the one with the flashiest headlines. Gold, often dismissed as dead money, quietly crushed equities during several major equity drawdowns: the dot-com bust, the 2008 GFC, and more recently in 2022. While equities offer income and compound growth, gold has proved to be an unmatched hedge across cycles.
For long-term investors, the lesson is clear the best portfolio isn’t always 100% stocks. Real diversification, especially across major asset classes like equities and gold, is how you preserve wealth and capture upside across market regimes.
I can hear the comments now… now do Bitcoin… we all know Bitcoin is king
#Gold #SP500 #LongTermInvesting #AssetAllocation #WealthPreservation #FinancialFreedom #PortfolioStrategy #InvestingWisdom #MacroTrends #InvestmentReturns #Diversify #HardAssets #InflationHedge #MacroInsights #MarketCycles
This chart flips a long-standing market narrative on its head. Over the past 25+ years, gold has significantly outperformed the S&P 500 delivering a total annualized return of 9.63%, compared to just 8.00% for the S&P 500 (including dividends). Starting from $100,000 in 1999, a gold investor would now be sitting on nearly $1.2 million, while the same investment in the S&P 500 would be just under $800k.
It’s a striking reminder that asset allocation matters and that sometimes the best-performing asset isn’t the one with the flashiest headlines. Gold, often dismissed as dead money, quietly crushed equities during several major equity drawdowns: the dot-com bust, the 2008 GFC, and more recently in 2022. While equities offer income and compound growth, gold has proved to be an unmatched hedge across cycles.
For long-term investors, the lesson is clear the best portfolio isn’t always 100% stocks. Real diversification, especially across major asset classes like equities and gold, is how you preserve wealth and capture upside across market regimes.
I can hear the comments now… now do Bitcoin… we all know Bitcoin is king 👑 🦍
#Gold #SP500 #LongTermInvesting #AssetAllocation #WealthPreservation #FinancialFreedom #PortfolioStrategy #InvestingWisdom #MacroTrends #InvestmentReturns #Diversify #HardAssets #InflationHedge #MacroInsights #MarketCycles
·613 مشاهدة
·0 معاينة