Japan is quietly becoming the most important macro story in the world. How long can this go on for?
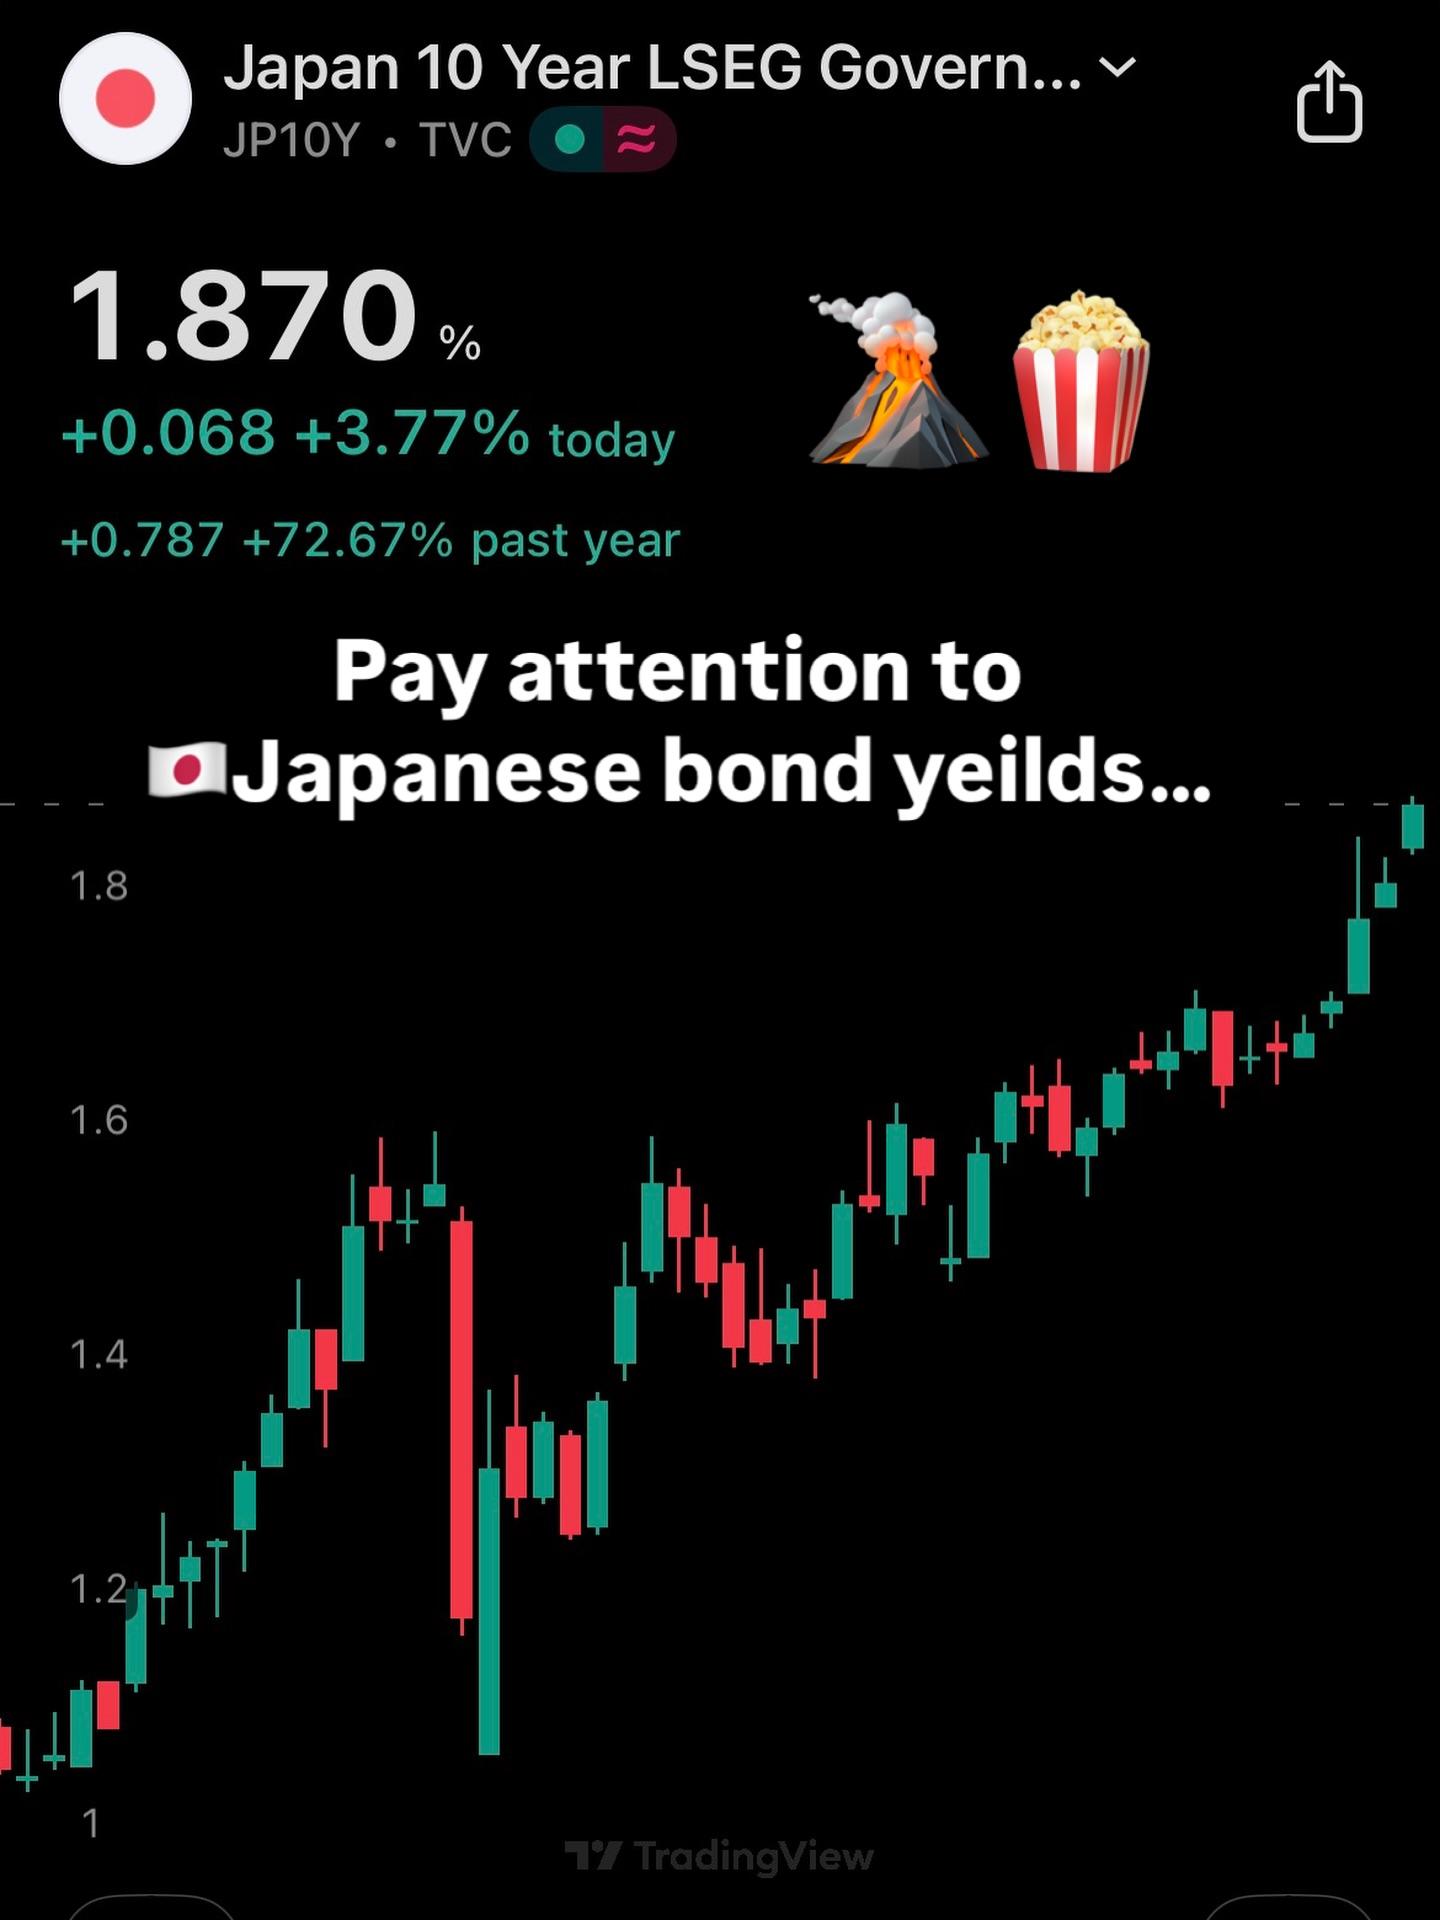
The country with the highest debt to GDP ratio on earth is now facing rising yields. The 10 year Japanese government bond is pushing toward 2 percent up more than 70 percent in a year.
Japan has lived in a world of near zero rates for decades. A world where its central bank could buy its own bonds indefinitely, keep yields pinned down, and create the illusion of stability. That era is ending.
The Bank of Japan has tried every tool: negative rates, quantitative easing, and now yield curve control. But there’s a simple truth: markets eventually overpower intervention.
If the BoJ keeps buying bonds to suppress yields, the currency weakens.
If it stops buying, yields spike and debt service costs explode.
Japan is stuck between two bad choices.
The debt burden is over 250 percent of GDP. Higher rates mean higher interest expenses, and that means more borrowing just to pay the interest. The problem becomes exponential.
If yield curve control breaks, you will see one of two outcomes:
A currency crisis the yen collapses to absorb the pressure.
A bond crisis yields blow out and force deleveraging at a scale Japan hasn’t seen in modern history.
For years investors believed Japan could never break. Zero rates were permanent. Demographics were destiny. Now the market is testing that assumption.
Japan matters because it’s the endgame experiment:
What happens when a government prints for decades, monetizes debt, and finally runs out of tools?
Everyone focuses on the United States. But if Japan snaps first, it will be a global shockwave.
How does this end? Incredibly slowly… then all at once.
Liquidity is what everyone is grasping for 😮💨
#japan #macro #markets #bonds #economics #investing #finance #interestrates #debt #yen #bankofjapan #globalmacro #riskmanagement #wealthbuilding #economy #marketanalysis
Japan is quietly becoming the most important macro story in the world. How long can this go on for?
The country with the highest debt to GDP ratio on earth is now facing rising yields. The 10 year Japanese government bond is pushing toward 2 percent up more than 70 percent in a year.
Japan has lived in a world of near zero rates for decades. A world where its central bank could buy its own bonds indefinitely, keep yields pinned down, and create the illusion of stability. That era is ending.
The Bank of Japan has tried every tool: negative rates, quantitative easing, and now yield curve control. But there’s a simple truth: markets eventually overpower intervention.
If the BoJ keeps buying bonds to suppress yields, the currency weakens.
If it stops buying, yields spike and debt service costs explode.
Japan is stuck between two bad choices.
The debt burden is over 250 percent of GDP. Higher rates mean higher interest expenses, and that means more borrowing just to pay the interest. The problem becomes exponential.
If yield curve control breaks, you will see one of two outcomes:
A currency crisis the yen collapses to absorb the pressure.
A bond crisis yields blow out and force deleveraging at a scale Japan hasn’t seen in modern history.
For years investors believed Japan could never break. Zero rates were permanent. Demographics were destiny. Now the market is testing that assumption.
Japan matters because it’s the endgame experiment:
What happens when a government prints for decades, monetizes debt, and finally runs out of tools?
Everyone focuses on the United States. But if Japan snaps first, it will be a global shockwave.
How does this end? Incredibly slowly… then all at once.
Liquidity is what everyone is grasping for 😮💨
#japan #macro #markets #bonds #economics #investing #finance #interestrates #debt #yen #bankofjapan #globalmacro #riskmanagement #wealthbuilding #economy #marketanalysis
·339 Просмотры
·0 предпросмотр