


• Why "Restart to Resize" Is Dying: How In-Place Pod Scaling & Scheduler Preemption Fix Kubernetes Overprovisioning


    For over a decade, horizontal scaling (HPA) was the default Kubernetes reaction to traffic surges. But for stateful workloads—databases, distributed caches, and LLM inference engines with gigabytes of weights loaded into memory—horizontal scaling is often too slow, expensive, or architecturally impossible.


    Until recently, vertical scaling (VPA) carried a painful tradeoff: updating a container's resource requests or limits required recreating the Pod.


    Recreating a pod means:
    Severing active TCP sessions and draining connections.
    Forcing stateful nodes to warm their local memory, page caches, and scratch disks from scratch.


    Increasing initialization latencies from milliseconds to minutes.


    The Architectural Shift: Dynamic In-Place Scaling Meets Scheduler Preemption
    Cloud-native operations have matured beyond destructive restarts. Through the progression of In-Place Pod Vertical Scaling and centralized Scheduler Preemption for In-Place Resizing, the control plane now treats resource boundaries as dynamic parameters rather than immutable pod specs:


    Zero-Downtime Resource Expansion: When a container hits its memory or CPU threshold, the control plane updates the cgroups hierarchy directly via the Kubelet on the existing host without terminating the process or cycling PID 1.


    Centralized Scheduler Coordination: Instead of letting local Kubelets make ad-hoc, conflicting eviction decisions during a resize, the centralized scheduler evaluates pods in a Deferred resize state. It tracks capacity reservations to prevent double-allocation and scheduling races.


    Localized, Node-Scoped Preemption: When a high-priority pod needs immediate vertical headroom on a saturated node, the scheduler evaluates eligible lower-priority victim pods strictly localized to that specific host. It initiates graceful evictions under Pod Disruption Budgets (PDBs) to clear host headroom dynamically.


    Treating infrastructure capacity as elastic at the node level eliminates the need to over-provision static headroom "just in case." You can run tight cluster bin-packing while maintaining the responsiveness needed for unpredictable, latency-sensitive workloads.


    Discussion Question
    For workloads with high warm-up overhead (like Redis, JVM services, or inference models), do you currently over-provision static limits to avoid pod restarts, or are you adopting in-place cgroup vertical scaling?


    CTA
    Stop wasting compute and engineer truly resilient cloud-native infrastructure. Connect with SREs, platform engineers, and cloud architects inside Cloud, DevOps & Open Source to exchange production Kubernetes configurations, capacity planning playbooks, and GitOps workflows.
    Why "Restart to Resize" Is Dying: How In-Place Pod Scaling & Scheduler Preemption Fix Kubernetes Overprovisioning For over a decade, horizontal scaling (HPA) was the default Kubernetes reaction to traffic surges. But for stateful workloads—databases, distributed caches, and LLM inference engines with gigabytes of weights loaded into memory—horizontal scaling is often too slow, expensive, or architecturally impossible. Until recently, vertical scaling (VPA) carried a painful tradeoff: updating a container's resource requests or limits required recreating the Pod. Recreating a pod means: Severing active TCP sessions and draining connections. Forcing stateful nodes to warm their local memory, page caches, and scratch disks from scratch. Increasing initialization latencies from milliseconds to minutes. The Architectural Shift: Dynamic In-Place Scaling Meets Scheduler Preemption Cloud-native operations have matured beyond destructive restarts. Through the progression of In-Place Pod Vertical Scaling and centralized Scheduler Preemption for In-Place Resizing, the control plane now treats resource boundaries as dynamic parameters rather than immutable pod specs: Zero-Downtime Resource Expansion: When a container hits its memory or CPU threshold, the control plane updates the cgroups hierarchy directly via the Kubelet on the existing host without terminating the process or cycling PID 1. Centralized Scheduler Coordination: Instead of letting local Kubelets make ad-hoc, conflicting eviction decisions during a resize, the centralized scheduler evaluates pods in a Deferred resize state. It tracks capacity reservations to prevent double-allocation and scheduling races. Localized, Node-Scoped Preemption: When a high-priority pod needs immediate vertical headroom on a saturated node, the scheduler evaluates eligible lower-priority victim pods strictly localized to that specific host. It initiates graceful evictions under Pod Disruption Budgets (PDBs) to clear host headroom dynamically. Treating infrastructure capacity as elastic at the node level eliminates the need to over-provision static headroom "just in case." You can run tight cluster bin-packing while maintaining the responsiveness needed for unpredictable, latency-sensitive workloads. Discussion Question For workloads with high warm-up overhead (like Redis, JVM services, or inference models), do you currently over-provision static limits to avoid pod restarts, or are you adopting in-place cgroup vertical scaling? CTA Stop wasting compute and engineer truly resilient cloud-native infrastructure. Connect with SREs, platform engineers, and cloud architects inside Cloud, DevOps & Open Source to exchange production Kubernetes configurations, capacity planning playbooks, and GitOps workflows.
    0 Commentarios 0 Acciones 223 Views 0 Vista previa
  • Why "Ticket-Ops" Is Killing Your Cloud Career (And How Platform Thinking Saves It)


    Gartner projected that 80% of large engineering organizations would establish dedicated platform teams by 2026—and looking across modern infrastructure stacks today, that reality is already here.


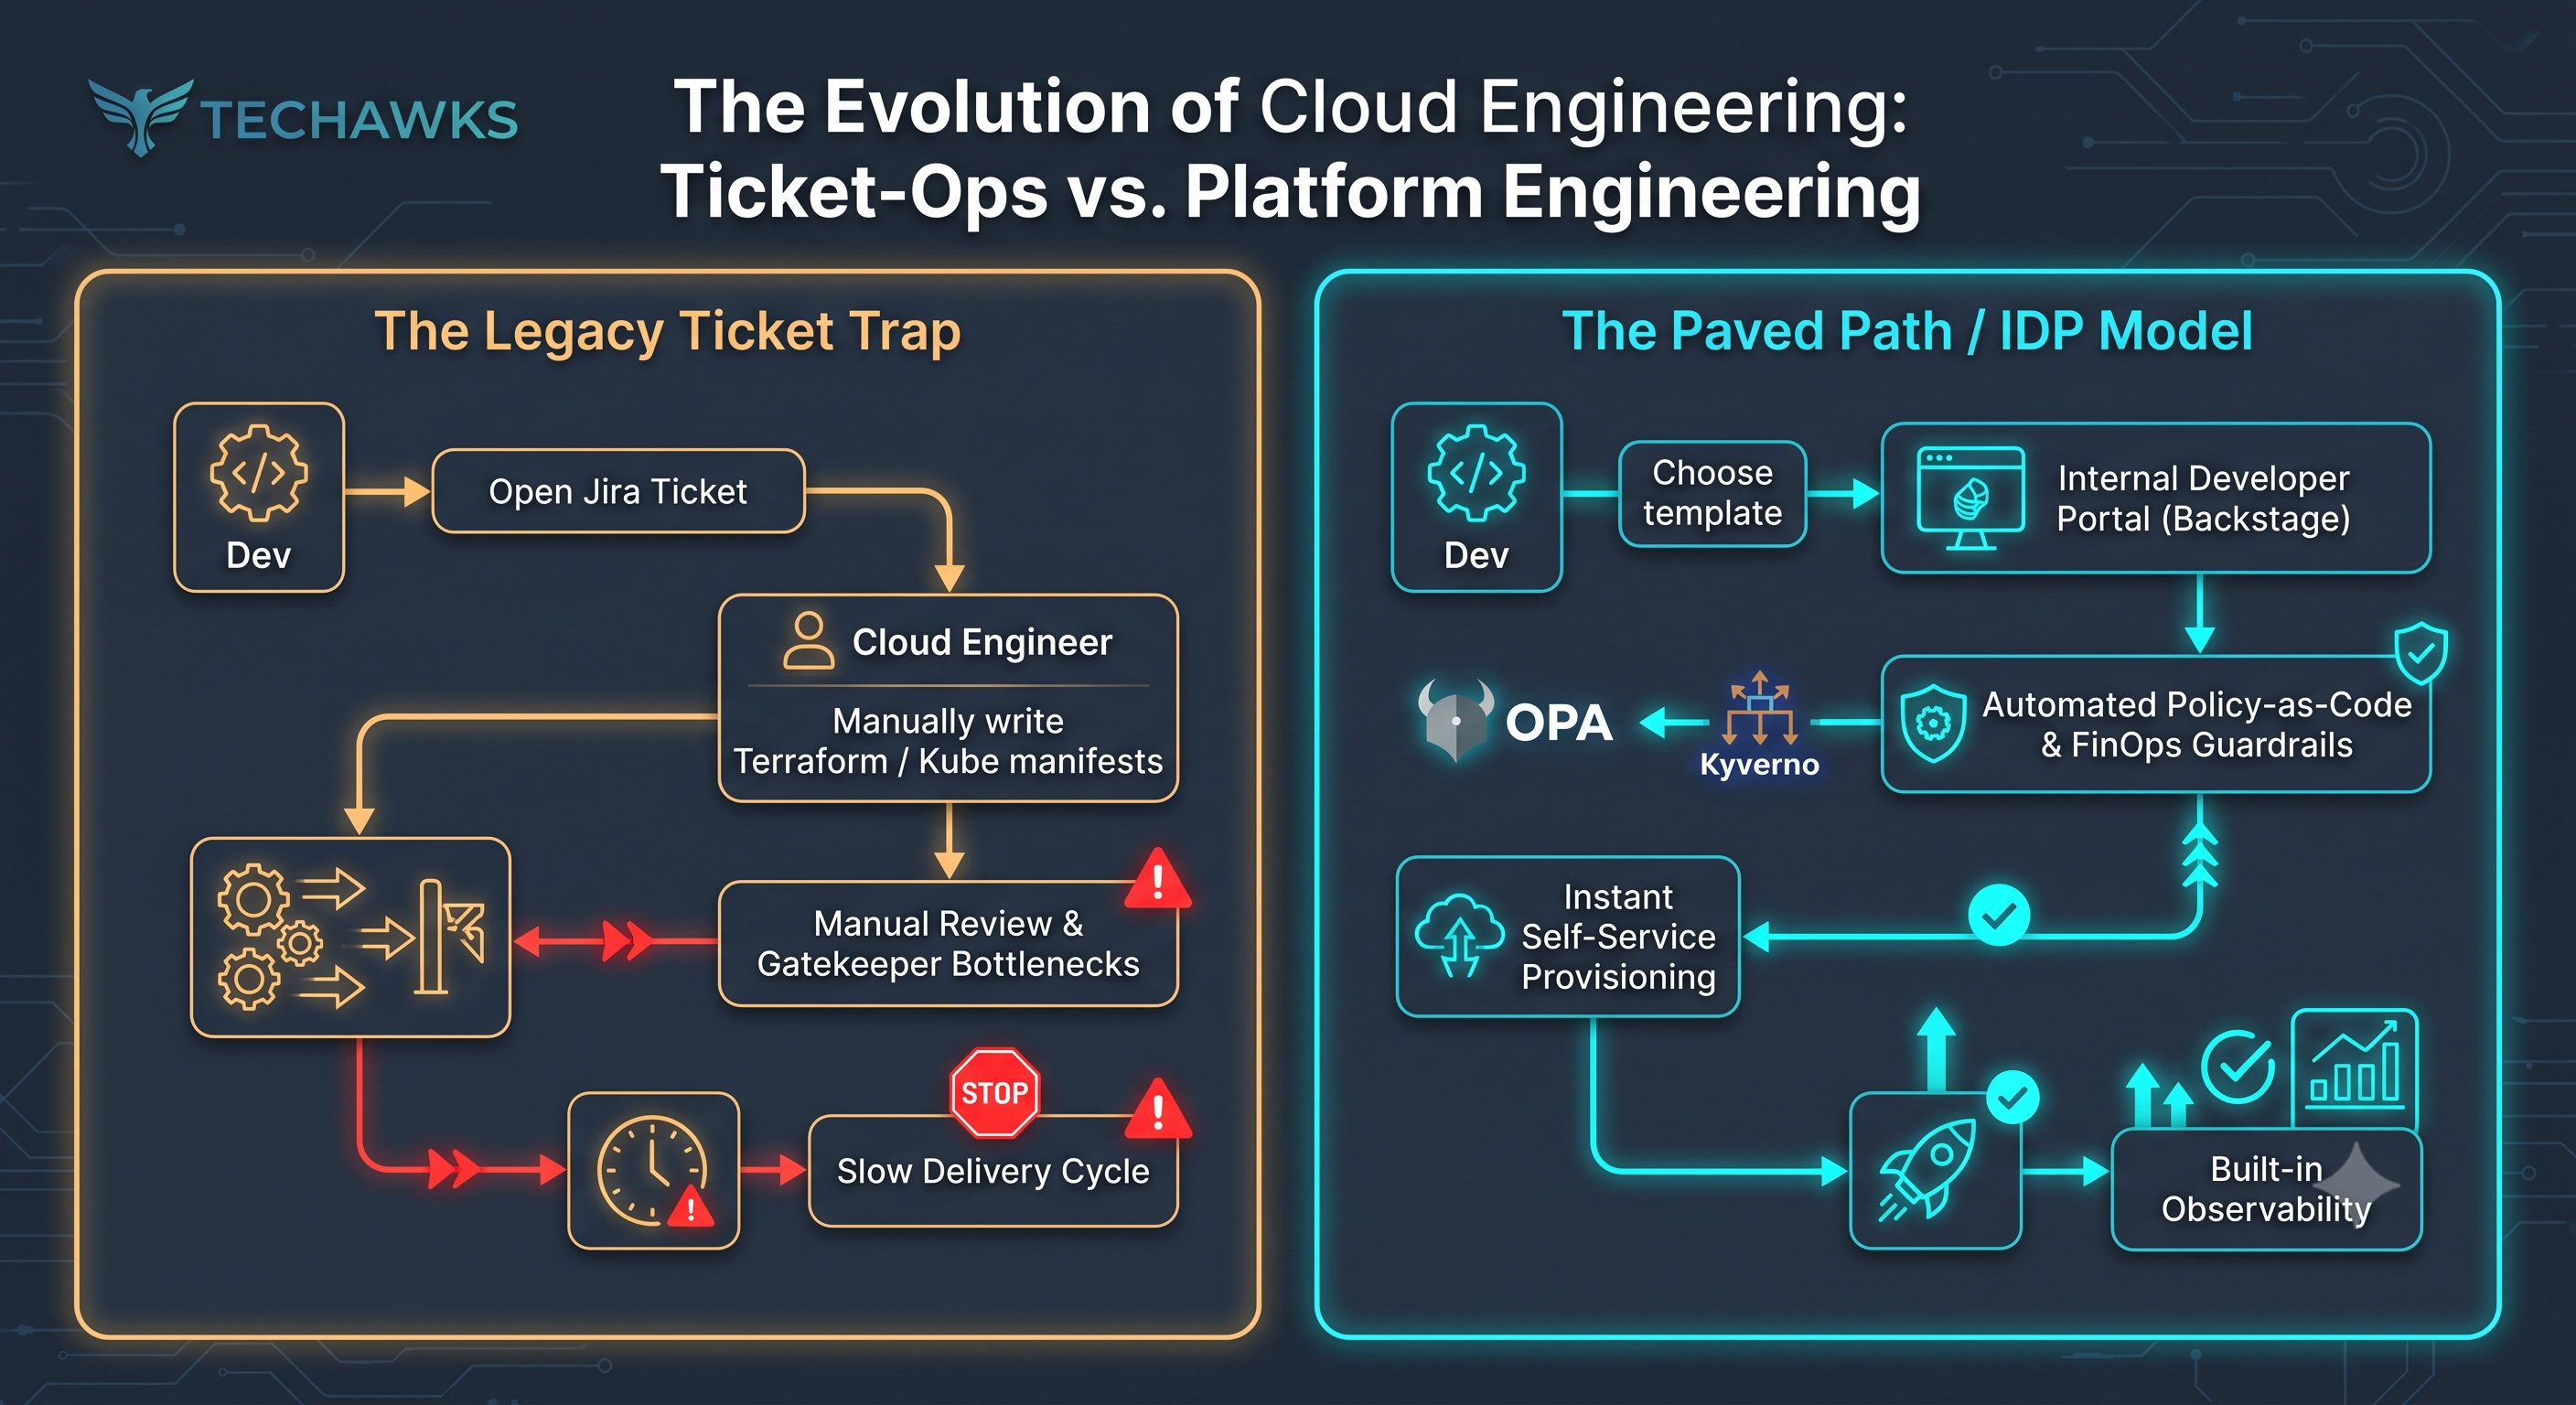
    Yet, far too many cloud engineers remain stuck in the "DevOps reactive trap":
    A developer needs an RDS cluster or S3 bucket -> They open a Jira ticket.
    You manually write HCL, run plan, get sign-off, and apply.
    A deployment breaks -> You get paged at 2 AM because nobody else understands the manifest.
    This is not DevOps; it is glorified operations disguised as automation.
    When AI coding assistants and automation tooling can generate boilerplate Terraform and Kubernetes manifests in seconds, the cloud engineers commanding top-tier career leverage aren’t the ones typing YAML—they are Platform Engineers treating infrastructure as an internal product.
    Here is how you shift your career from Reactive Operator to Platform Architect:


    1. Stop Provisioning Resources; Start Building "Golden Paths"
    Don’t hand developers raw cloud primitives where they can misconfigure security groups or incur run-away costs. Package your architecture into opinionated, self-service templates (via tools like Backstage or custom CLI workflows).
    Old way: Manually spinning up an EKS namespace and ingress on request.
    New way: Codifying a "Node.js service standard" where a developer runs one command to get repo scaffolding, automated CI/CD, RBAC, and telemetry out of the box.


    2. Trade "Manual Gates" for Policy-as-Code & FinOps Guardrails
    If you are the human bottleneck reviewing every pull request for IAM least-privilege or cost overruns, you don't scale.
    Enforce pre-commit and admission controls (using Kyverno, Open Policy Agent, or Infracost).
    Let code linters and CI policies block unencrypted storage or missing resource limits before you ever see a PR.


    3. Measure Value by "Developer Cognitive Load," Not Uptime
    Uptime is table stakes. High-leverage platform teams measure:
    Time to First Deploy: How fast can a new hire ship their first microservice to staging?
    Self-Service Adoption: Are engineers choosing your paved path over custom hacky pipelines?


    Career Takeaway: Your engineering value is no longer measured by how many cloud resources you personally manage. It’s measured by how many developers can safely deploy to production without ever having to speak with you.


    Discussion Question
    What is the single biggest bottleneck in your current deployment workflow: slow approval gates, cognitive overload on complex Helm charts, or ticket-driven infrastructure requests?


    CTA
    Ready to move past reactive DevOps and build scalable internal platforms?
    👉 Join Cloud, DevOps & Open Source on Techawks for production architectures, platform engineering blueprints, and open-source tooling breakdowns.
    Why "Ticket-Ops" Is Killing Your Cloud Career (And How Platform Thinking Saves It) Gartner projected that 80% of large engineering organizations would establish dedicated platform teams by 2026—and looking across modern infrastructure stacks today, that reality is already here. Yet, far too many cloud engineers remain stuck in the "DevOps reactive trap": A developer needs an RDS cluster or S3 bucket -> They open a Jira ticket. You manually write HCL, run plan, get sign-off, and apply. A deployment breaks -> You get paged at 2 AM because nobody else understands the manifest. This is not DevOps; it is glorified operations disguised as automation. When AI coding assistants and automation tooling can generate boilerplate Terraform and Kubernetes manifests in seconds, the cloud engineers commanding top-tier career leverage aren’t the ones typing YAML—they are Platform Engineers treating infrastructure as an internal product. Here is how you shift your career from Reactive Operator to Platform Architect: 1. Stop Provisioning Resources; Start Building "Golden Paths" Don’t hand developers raw cloud primitives where they can misconfigure security groups or incur run-away costs. Package your architecture into opinionated, self-service templates (via tools like Backstage or custom CLI workflows). Old way: Manually spinning up an EKS namespace and ingress on request. New way: Codifying a "Node.js service standard" where a developer runs one command to get repo scaffolding, automated CI/CD, RBAC, and telemetry out of the box. 2. Trade "Manual Gates" for Policy-as-Code & FinOps Guardrails If you are the human bottleneck reviewing every pull request for IAM least-privilege or cost overruns, you don't scale. Enforce pre-commit and admission controls (using Kyverno, Open Policy Agent, or Infracost). Let code linters and CI policies block unencrypted storage or missing resource limits before you ever see a PR. 3. Measure Value by "Developer Cognitive Load," Not Uptime Uptime is table stakes. High-leverage platform teams measure: Time to First Deploy: How fast can a new hire ship their first microservice to staging? Self-Service Adoption: Are engineers choosing your paved path over custom hacky pipelines? Career Takeaway: Your engineering value is no longer measured by how many cloud resources you personally manage. It’s measured by how many developers can safely deploy to production without ever having to speak with you. Discussion Question What is the single biggest bottleneck in your current deployment workflow: slow approval gates, cognitive overload on complex Helm charts, or ticket-driven infrastructure requests? CTA Ready to move past reactive DevOps and build scalable internal platforms? 👉 Join Cloud, DevOps & Open Source on Techawks for production architectures, platform engineering blueprints, and open-source tooling breakdowns.
    0 Commentarios 0 Acciones 463 Views 0 Vista previa
  • The Hidden Danger of "Permissive" Ephemeral Infrastructure: Hardening Your CI/CD & Cluster Control Plane


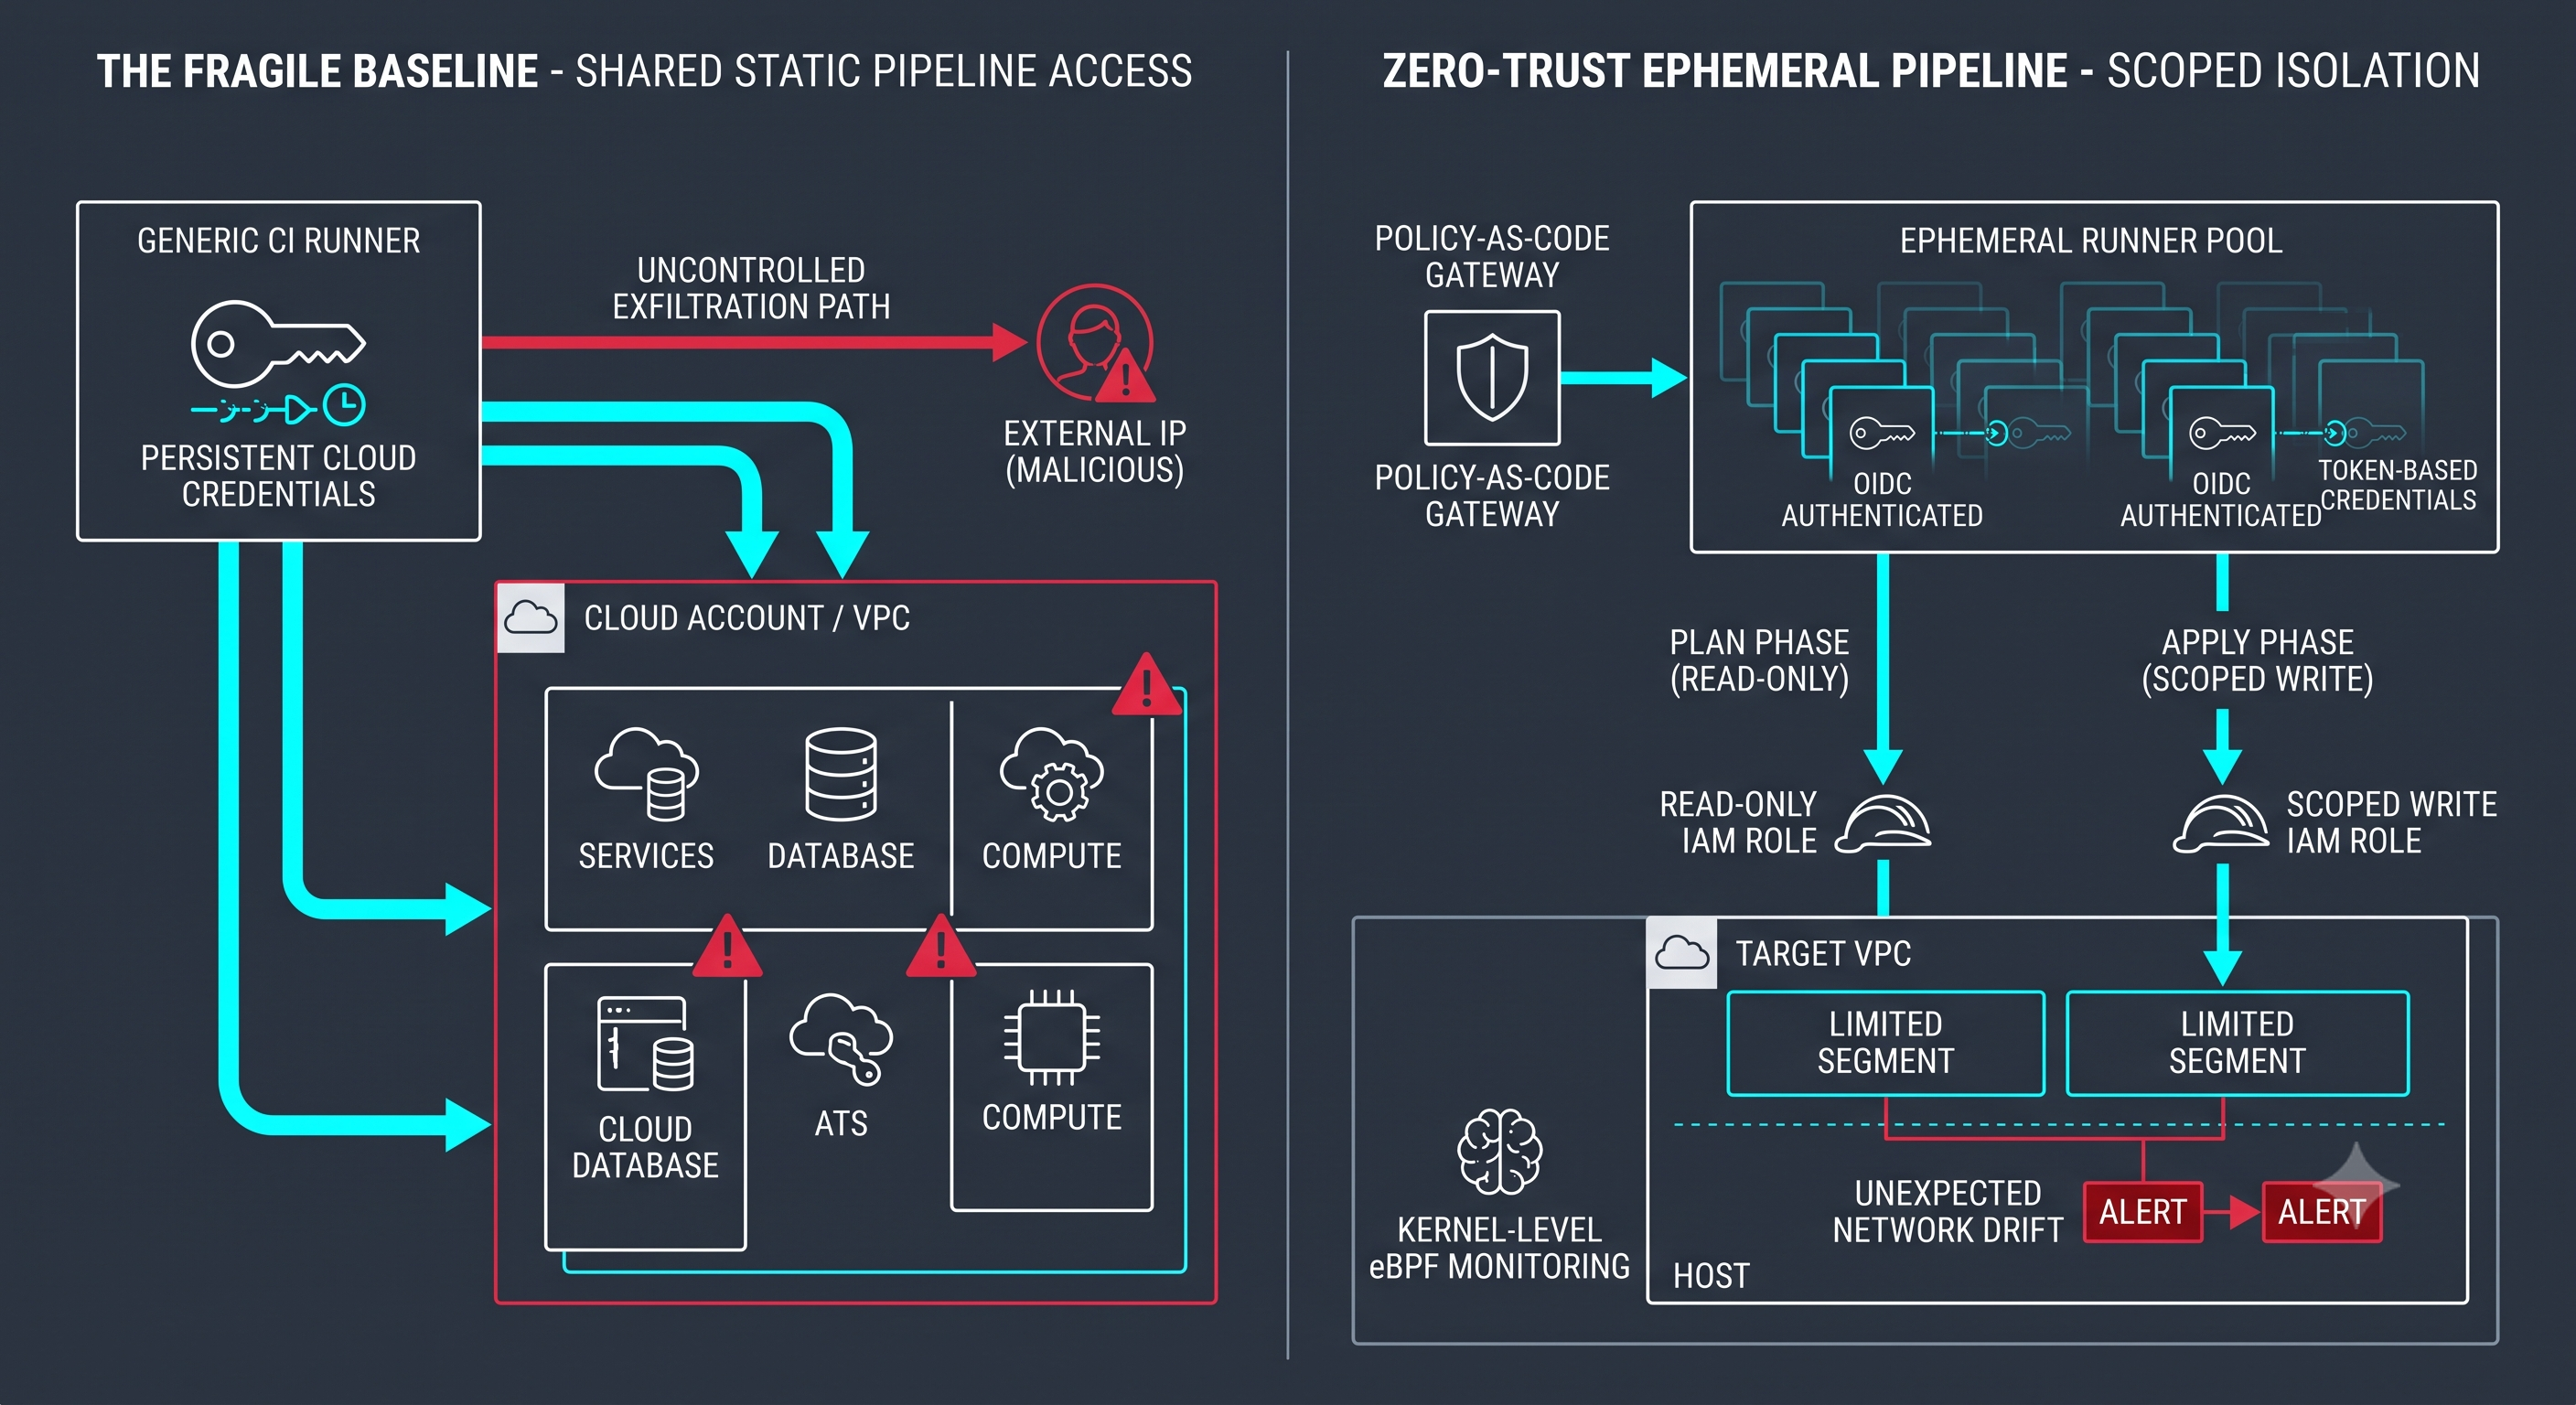
    As teams scale GitOps and platform engineering, infrastructure provisioning has become fully dynamic. Dynamic runners spin up, assume cloud IAM roles, apply Kubernetes manifests or IaC modules, and terminate.


    The trap? Ephemeral execution with static trust.


    Engineers often grant wide IAM permissions (e.g., * on S3 buckets, wide VPC modification, or cluster-admin service accounts) under the false assumption that because the runner lives for only 6 minutes, the blast radius is negligible. In practice, compromised third-party dependencies, malicious PR actions, or leaked pipeline context tokens convert short-lived environments into full control plane takeover vectors.
    Resilient cloud architecture demands that credential lifespans match the micro-task, not the entire build pipeline.


    Before your next release cycle, run this audit across your deployment pipelines:


    The Zero-Trust Ephemeral Infrastructure Checklist


    [ ] 1. Enforce Workload Identity Federation (No Static API Keys)
    Eliminate static access keys stored in CI variables. Mandate OIDC (OpenID Connect) federation (e.g., GitHub Actions/GitLab OIDC to AWS IAM, GCP Workload Identity, or Azure Federated Credentials) with strictly bounded audience and subject claims.


    [ ] 2. Scope IAM to Single Plan/Apply Phases (Task-Level Scoping)
    Decouple your pipeline roles: the "plan/spec" phase receives strictly read-only metadata permissions, while the "apply" phase receives narrow write access restricted to the targeted state file and VPC resources.


    [ ] 3. Adopt Kernel-Level Runtime Observability (eBPF)
    Traditional container logs miss unauthorized outbound connections or privilege escalations initiated inside dynamic runners. Deploy eBPF-based runtime monitoring (such as Cilium or Falco) to flag unexpected process execution at the host level.


    [ ] 4. Enforce Policy-as-Code Gates Before State Locking
    Integrate deterministic validation (Open Policy Agent/Rego, Kyverno, or Trivy) inside the pipeline. Block deployments automatically if a pull request introduces open security groups (0.0.0.0/0), elevated container privileges, or missing encryption tags.


    [ ] 5. Cap Token TTL to Sub-Hour Limits
    Set the maximum session duration for assumed STS/IAM roles to match the mean pipeline runtime (e.g., 15–30 minutes), preventing cached credential reuse in the event of an artifact leak.


    [ ] 6. Isolate Dynamic Runners in Dedicated VPCs
    Ensure dynamic runners and build agents do not run in the same internal network plane as staging or production databases. Enforce strict egress filtering—runners only connect to designated registries and cloud control-plane endpoints.


    Discussion Question
    How does your team enforce the boundary between read-only evaluation and write-level deployment privileges inside automated GitOps workflows?


    CTA
    Join Cloud, DevOps & Open Source — follow Techawks Cloud & DevOps for hands-on architectural blueprints, infrastructure teardowns, and actionable reliability checklists.
    The Hidden Danger of "Permissive" Ephemeral Infrastructure: Hardening Your CI/CD & Cluster Control Plane As teams scale GitOps and platform engineering, infrastructure provisioning has become fully dynamic. Dynamic runners spin up, assume cloud IAM roles, apply Kubernetes manifests or IaC modules, and terminate. The trap? Ephemeral execution with static trust. Engineers often grant wide IAM permissions (e.g., * on S3 buckets, wide VPC modification, or cluster-admin service accounts) under the false assumption that because the runner lives for only 6 minutes, the blast radius is negligible. In practice, compromised third-party dependencies, malicious PR actions, or leaked pipeline context tokens convert short-lived environments into full control plane takeover vectors. Resilient cloud architecture demands that credential lifespans match the micro-task, not the entire build pipeline. Before your next release cycle, run this audit across your deployment pipelines: The Zero-Trust Ephemeral Infrastructure Checklist [ ] 1. Enforce Workload Identity Federation (No Static API Keys) Eliminate static access keys stored in CI variables. Mandate OIDC (OpenID Connect) federation (e.g., GitHub Actions/GitLab OIDC to AWS IAM, GCP Workload Identity, or Azure Federated Credentials) with strictly bounded audience and subject claims. [ ] 2. Scope IAM to Single Plan/Apply Phases (Task-Level Scoping) Decouple your pipeline roles: the "plan/spec" phase receives strictly read-only metadata permissions, while the "apply" phase receives narrow write access restricted to the targeted state file and VPC resources. [ ] 3. Adopt Kernel-Level Runtime Observability (eBPF) Traditional container logs miss unauthorized outbound connections or privilege escalations initiated inside dynamic runners. Deploy eBPF-based runtime monitoring (such as Cilium or Falco) to flag unexpected process execution at the host level. [ ] 4. Enforce Policy-as-Code Gates Before State Locking Integrate deterministic validation (Open Policy Agent/Rego, Kyverno, or Trivy) inside the pipeline. Block deployments automatically if a pull request introduces open security groups (0.0.0.0/0), elevated container privileges, or missing encryption tags. [ ] 5. Cap Token TTL to Sub-Hour Limits Set the maximum session duration for assumed STS/IAM roles to match the mean pipeline runtime (e.g., 15–30 minutes), preventing cached credential reuse in the event of an artifact leak. [ ] 6. Isolate Dynamic Runners in Dedicated VPCs Ensure dynamic runners and build agents do not run in the same internal network plane as staging or production databases. Enforce strict egress filtering—runners only connect to designated registries and cloud control-plane endpoints. Discussion Question How does your team enforce the boundary between read-only evaluation and write-level deployment privileges inside automated GitOps workflows? CTA Join Cloud, DevOps & Open Source — follow Techawks Cloud & DevOps for hands-on architectural blueprints, infrastructure teardowns, and actionable reliability checklists.
    0 Commentarios 0 Acciones 421 Views 0 Vista previa
  • Architecting Zero-Egress RAG for UAE Sovereign AI Compliance


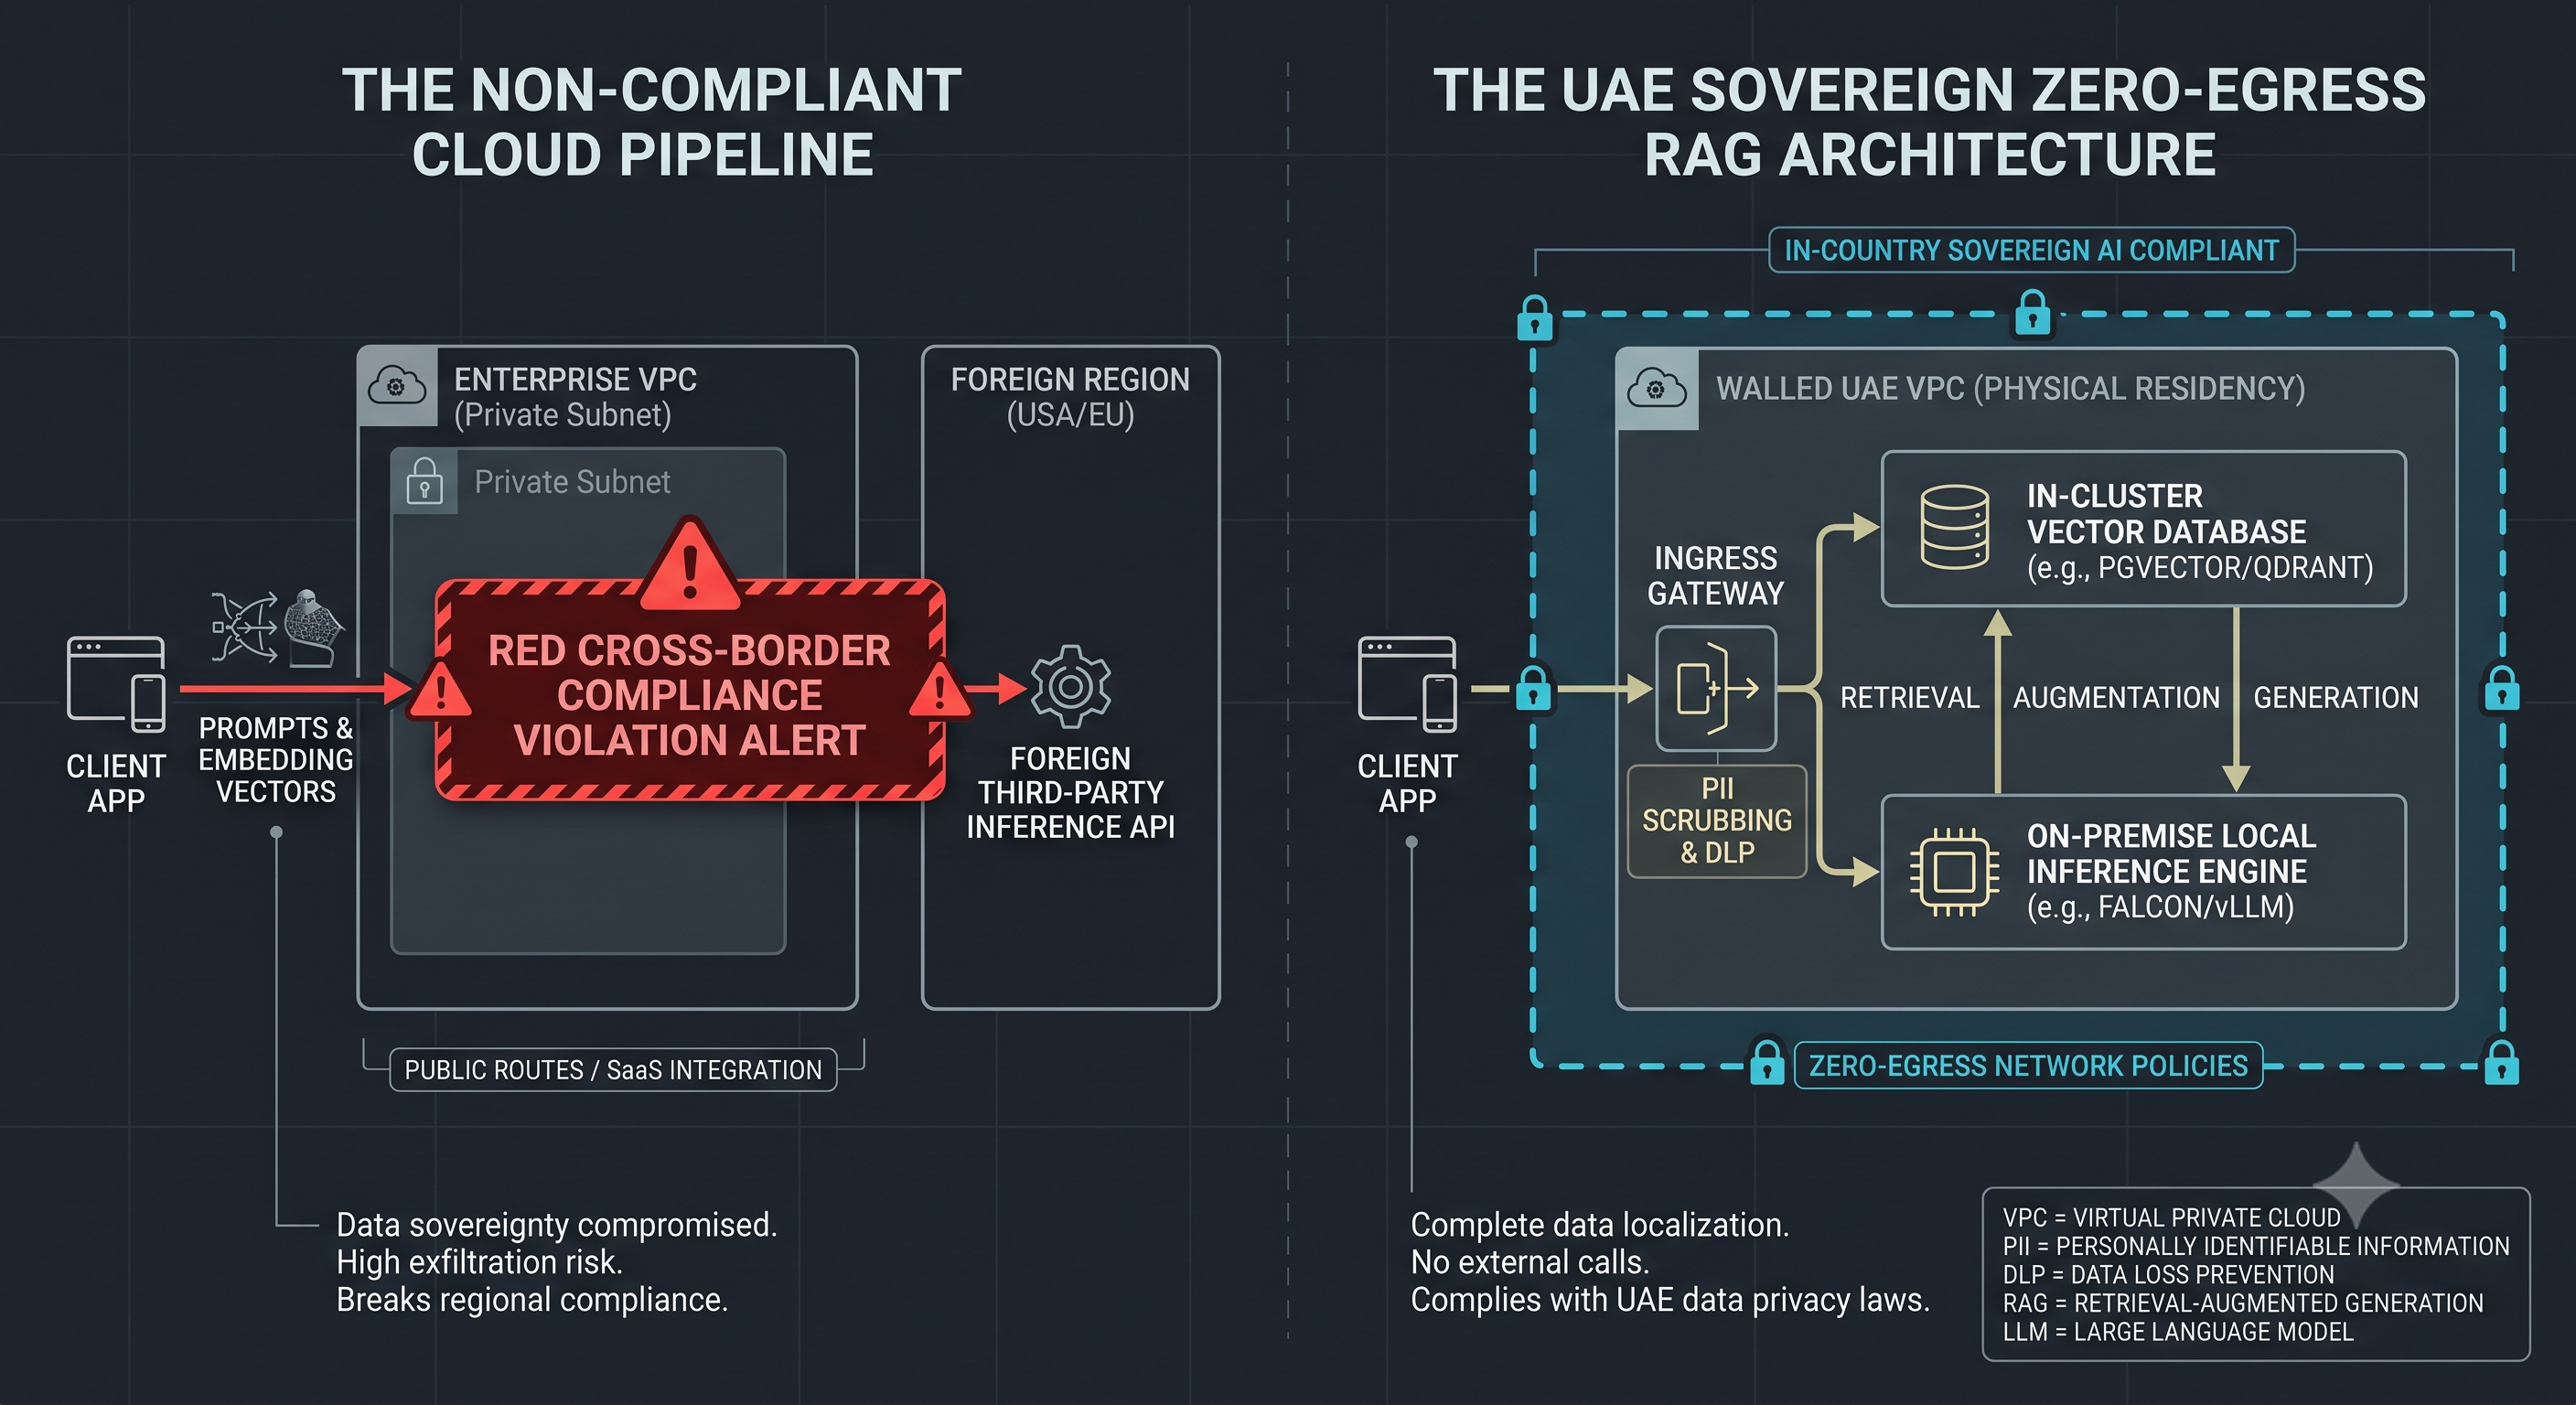
    With UAE regulatory enforcement intensifying around cross-border telemetry and data residency, enterprise engineering teams in Dubai and Abu Dhabi face a hard constraint: critical citizen data, corporate IP, and regulated customer records cannot leave national borders.


    Sending vector embeddings, raw prompt contexts, or fine-tuning datasets to public SaaS inference endpoints outside the country breaks compliance by design. Sovereign AI is not just about choosing an open-weight base model—it is about enforcing strict, zero-egress data planes.


    Here is an architectural blueprint to build an in-country, zero-egress RAG pipeline using open-weight models (such as Falcon or Jais) running entirely on sovereign UAE compute.


    1. Isolate the Compute and Model Tier
    Deploy your foundational model within local boundaries (e.g., Azure UAE Central/North regions, sovereign GPU providers like Core42, or air-gapped on-premise infrastructure).
    Pull open-weight checkpoints (e.g., Falcon-2 or Jais-13b-chat) and run inference through high-throughput engines like vLLM or TGI (Text Generation Inference) isolated inside your private VPC.


    Disable all outbound public internet routing on your model worker nodes:
    Bash
    # Verify no default outbound route exists on the inference subnet
    ip route show | grep default
    # Ensure traffic to external endpoints drops immediately
    curl --connect-timeout 3 https://api.openai.com || echo "Egress blocked: Verified."


    2. Deploy Local Vector Stores with Hardware-Isolated Tenants
    Avoid managed multi-tenant vector clouds hosted outside the GCC. Host an internal instance of Qdrant, pgvector, or Milvus within your secure cluster:
    Enforce TLS 1.3 encryption for in-flight embedding ingestion.
    Generate embeddings in-VPC using open embedding models (such as bge-m3 or local multilingual BERT variants) so that raw documents are tokenized and vectorized without exposing plaintext payloads to external networks.


    3. Implement Ingress Sanitization and Redaction
    Before enterprise context enters your retrieval pipeline:
    Run a local Named Entity Recognition (NER) model at your ingress gateway to detect Emirates IDs, payment data, and sensitive PII.
    Enforce prompt scrubbing and strict Data Loss Prevention (DLP) rules prior to context injection.


    4. Audit VPC Telemetry and DNS Leaks
    Even if inference is local, client SDKs often default to sending background usage analytics or crash metrics to overseas SaaS telemetry endpoints.
    Route cluster DNS queries through an internal, logging DNS resolver (e.g., CoreDNS).
    Configure network security groups to explicitly drop UDP/TCP port 53 traffic aimed at public resolvers (8.8.8.8, 1.1.1.1), terminating all internal name resolution within your UAE private network.
    Building sovereign AI infrastructure shifts data protection from an operational policy document into an immutable infrastructure constraint.


    Discussion Question
    When deploying local generative models across UAE enterprise workloads, are you containerizing self-hosted open-weight models in private VPCs, or relying on dedicated, UAE-domiciled sovereign cloud managed endpoints?


    CTA (Join Techawks UAE)
    Join the Techawks UAE community to exchange architectural patterns, deployment playbooks, and systems engineering benchmarks with developers and cloud architects across the Emirates.
    Architecting Zero-Egress RAG for UAE Sovereign AI Compliance With UAE regulatory enforcement intensifying around cross-border telemetry and data residency, enterprise engineering teams in Dubai and Abu Dhabi face a hard constraint: critical citizen data, corporate IP, and regulated customer records cannot leave national borders. Sending vector embeddings, raw prompt contexts, or fine-tuning datasets to public SaaS inference endpoints outside the country breaks compliance by design. Sovereign AI is not just about choosing an open-weight base model—it is about enforcing strict, zero-egress data planes. Here is an architectural blueprint to build an in-country, zero-egress RAG pipeline using open-weight models (such as Falcon or Jais) running entirely on sovereign UAE compute. 1. Isolate the Compute and Model Tier Deploy your foundational model within local boundaries (e.g., Azure UAE Central/North regions, sovereign GPU providers like Core42, or air-gapped on-premise infrastructure). Pull open-weight checkpoints (e.g., Falcon-2 or Jais-13b-chat) and run inference through high-throughput engines like vLLM or TGI (Text Generation Inference) isolated inside your private VPC. Disable all outbound public internet routing on your model worker nodes: Bash # Verify no default outbound route exists on the inference subnet ip route show | grep default # Ensure traffic to external endpoints drops immediately curl --connect-timeout 3 https://api.openai.com || echo "Egress blocked: Verified." 2. Deploy Local Vector Stores with Hardware-Isolated Tenants Avoid managed multi-tenant vector clouds hosted outside the GCC. Host an internal instance of Qdrant, pgvector, or Milvus within your secure cluster: Enforce TLS 1.3 encryption for in-flight embedding ingestion. Generate embeddings in-VPC using open embedding models (such as bge-m3 or local multilingual BERT variants) so that raw documents are tokenized and vectorized without exposing plaintext payloads to external networks. 3. Implement Ingress Sanitization and Redaction Before enterprise context enters your retrieval pipeline: Run a local Named Entity Recognition (NER) model at your ingress gateway to detect Emirates IDs, payment data, and sensitive PII. Enforce prompt scrubbing and strict Data Loss Prevention (DLP) rules prior to context injection. 4. Audit VPC Telemetry and DNS Leaks Even if inference is local, client SDKs often default to sending background usage analytics or crash metrics to overseas SaaS telemetry endpoints. Route cluster DNS queries through an internal, logging DNS resolver (e.g., CoreDNS). Configure network security groups to explicitly drop UDP/TCP port 53 traffic aimed at public resolvers (8.8.8.8, 1.1.1.1), terminating all internal name resolution within your UAE private network. Building sovereign AI infrastructure shifts data protection from an operational policy document into an immutable infrastructure constraint. Discussion Question When deploying local generative models across UAE enterprise workloads, are you containerizing self-hosted open-weight models in private VPCs, or relying on dedicated, UAE-domiciled sovereign cloud managed endpoints? CTA (Join Techawks UAE) Join the Techawks UAE community to exchange architectural patterns, deployment playbooks, and systems engineering benchmarks with developers and cloud architects across the Emirates.
    0 Commentarios 0 Acciones 452 Views 0 Vista previa
  • Upgrading Edge Ingress to Hybrid Post-Quantum Key Exchange (ML-KEM-768)


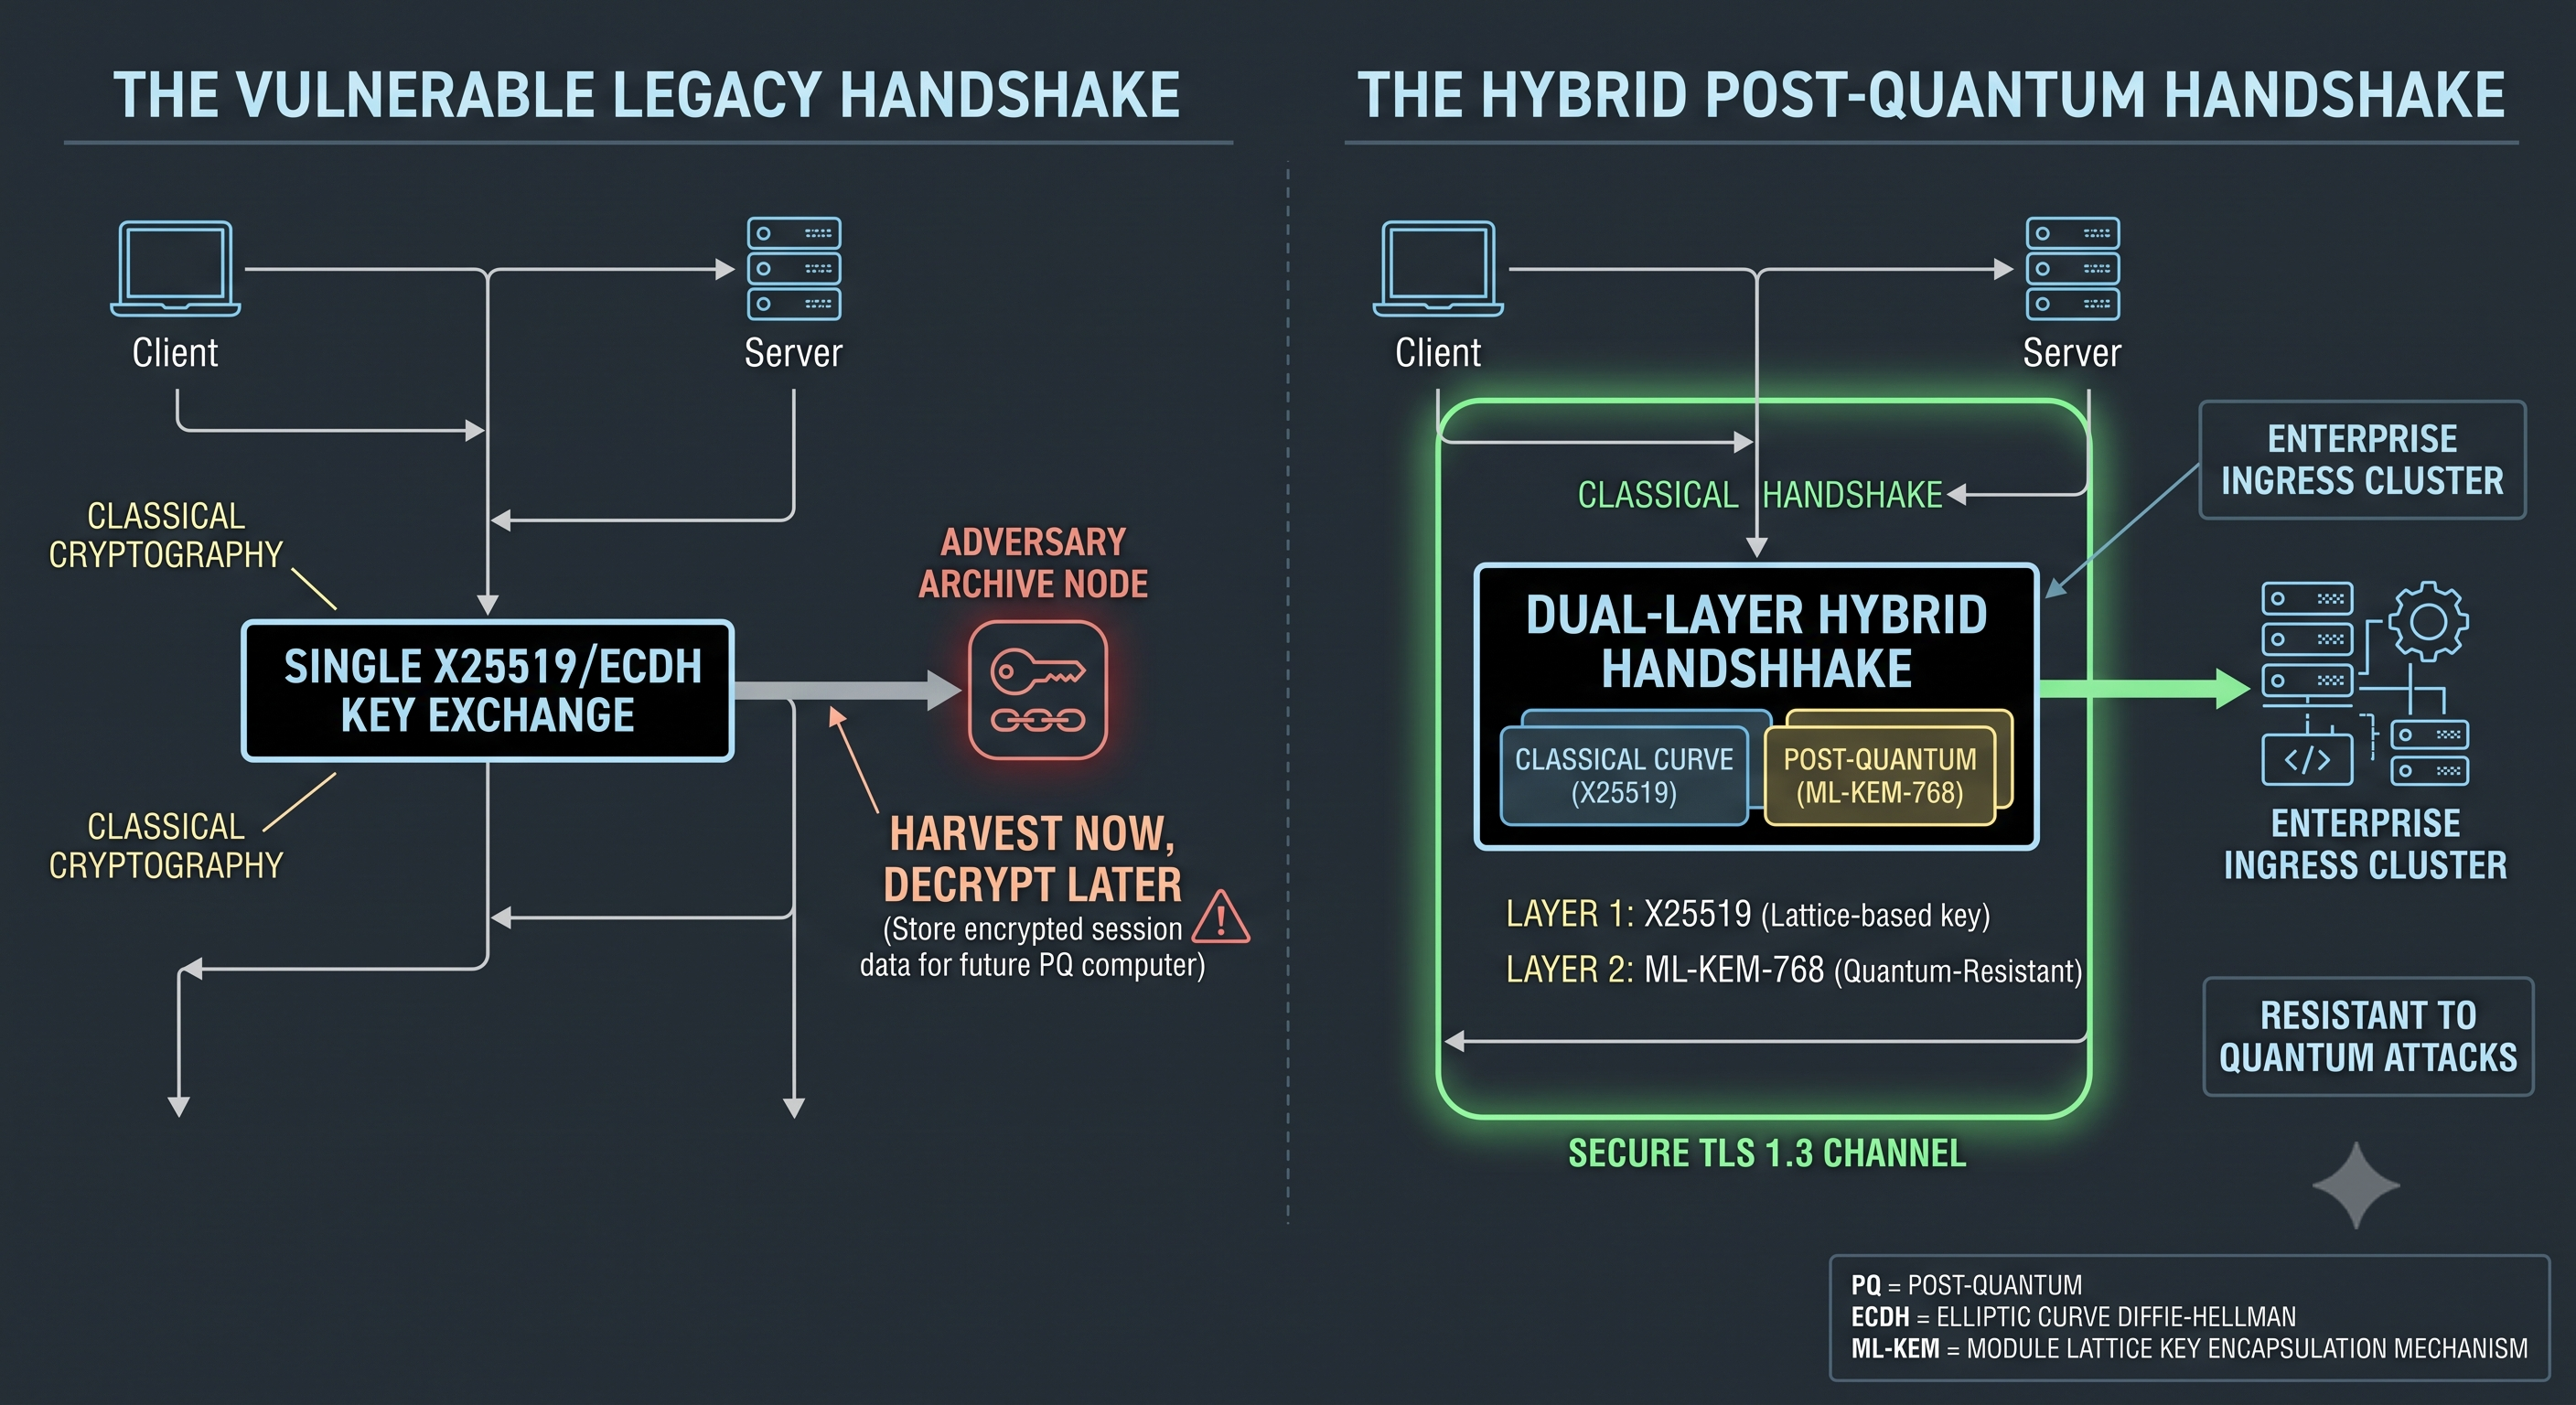
    "Harvest Now, Decrypt Later" (HNDL) is not a future vulnerability—adversaries are actively intercepting and storing encrypted traffic passing through UK internet exchanges. For UK engineering teams handling sensitive customer data, IP, or financial payloads with a 5+ year shelf-life, securing transit channels requires moving to hybrid key encapsulation right now.
    The UK National Cyber Security Centre (NCSC) guidance prioritises hybrid implementations as the bridge to complete quantum resistance: pairing classical curves with lattice-based algorithms so that legacy compliance and performance remain intact while establishing post-quantum security.
    Here is a practical tutorial to audit and test hybrid PQC on your ingress layer:


    1. Understand the Hybrid Mechanism
    Instead of negotiating a single secret over classical Elliptic Curve Diffie-Hellman (ECDH), hybrid key exchange (such as X25519Kyber768Draft00 / X25519MLKEM768) performs two handshakes simultaneously inside TLS 1.3:
    Classical component: Standard X25519 ensures backward compatibility and baseline cryptographic guarantees.
    Lattice component: ML-KEM-768 (standardised from Kyber) provides quantum-resistant encapsulation.
    The resulting shared secret is derived through HKDF (HMAC-based Extract-and-Expand Key Derivation Function) from both public keys, meaning an adversary must break both schemes to decrypt the payload.


    2. Audit Client Hello Sizes and MTU Fragmentation
    ML-KEM-768 public keys and ciphertexts are significantly larger than classical 32-byte X25519 keys (~1,184 bytes).
    Verify whether your edge proxies, WAFs, or upstream cloud load balancers drop Client Hello packets exceeding typical MTU thresholds (1,500 bytes).
    Ensure your ingress gateway supports TCP segmentation and TLS fragmentation properly without dropping truncated handshakes.


    3. Configure Ingress Testing (Envoy / OpenSSL 3.x / BoringSSL)
    In your edge proxy configuration (e.g., Envoy or modern NGINX built against an ML-KEM-capable OpenSSL/BoringSSL branch):
    Verify supported TLS 1.3 cipher suites and key exchange groups:
    YAML
    tls_certificates:
    - certificate_chain: { filename: "/etc/ssl/certs/ingress.crt" }
    private_key: { filename: "/etc/ssl/private/ingress.key" }
    tls_params:
    tls_minimum_protocol_version: TLSv1_3
    ecdh_curves:
    - X25519MLKEM768
    - X25519
    Deploy the configuration to a canary staging cluster.


    4. Validate via CLI
    Test your endpoint using a PQC-enabled build of curl or openssl:
    Bash
    openssl s_client -connect api.staging.internal:443 -tls1_3 -curves X25519MLKEM768
    Inspect the output to confirm Temp Key: ML-KEM-768 + X25519 was successfully agreed upon during the TLS 1.3 handshake.


    Discussion Question
    Has your team audited packet fragmentation risks for larger PQC key exchanges on existing reverse proxies, or are you waiting for cloud ingress providers to toggle it by default?


    CTA (Join Techawks UK)
    Join the Techawks UK community to connect with local systems engineers, platform leads, and cloud architects deploying resilient, quantum-ready infrastructure.
    Upgrading Edge Ingress to Hybrid Post-Quantum Key Exchange (ML-KEM-768) "Harvest Now, Decrypt Later" (HNDL) is not a future vulnerability—adversaries are actively intercepting and storing encrypted traffic passing through UK internet exchanges. For UK engineering teams handling sensitive customer data, IP, or financial payloads with a 5+ year shelf-life, securing transit channels requires moving to hybrid key encapsulation right now. The UK National Cyber Security Centre (NCSC) guidance prioritises hybrid implementations as the bridge to complete quantum resistance: pairing classical curves with lattice-based algorithms so that legacy compliance and performance remain intact while establishing post-quantum security. Here is a practical tutorial to audit and test hybrid PQC on your ingress layer: 1. Understand the Hybrid Mechanism Instead of negotiating a single secret over classical Elliptic Curve Diffie-Hellman (ECDH), hybrid key exchange (such as X25519Kyber768Draft00 / X25519MLKEM768) performs two handshakes simultaneously inside TLS 1.3: Classical component: Standard X25519 ensures backward compatibility and baseline cryptographic guarantees. Lattice component: ML-KEM-768 (standardised from Kyber) provides quantum-resistant encapsulation. The resulting shared secret is derived through HKDF (HMAC-based Extract-and-Expand Key Derivation Function) from both public keys, meaning an adversary must break both schemes to decrypt the payload. 2. Audit Client Hello Sizes and MTU Fragmentation ML-KEM-768 public keys and ciphertexts are significantly larger than classical 32-byte X25519 keys (~1,184 bytes). Verify whether your edge proxies, WAFs, or upstream cloud load balancers drop Client Hello packets exceeding typical MTU thresholds (1,500 bytes). Ensure your ingress gateway supports TCP segmentation and TLS fragmentation properly without dropping truncated handshakes. 3. Configure Ingress Testing (Envoy / OpenSSL 3.x / BoringSSL) In your edge proxy configuration (e.g., Envoy or modern NGINX built against an ML-KEM-capable OpenSSL/BoringSSL branch): Verify supported TLS 1.3 cipher suites and key exchange groups: YAML tls_certificates: - certificate_chain: { filename: "/etc/ssl/certs/ingress.crt" } private_key: { filename: "/etc/ssl/private/ingress.key" } tls_params: tls_minimum_protocol_version: TLSv1_3 ecdh_curves: - X25519MLKEM768 - X25519 Deploy the configuration to a canary staging cluster. 4. Validate via CLI Test your endpoint using a PQC-enabled build of curl or openssl: Bash openssl s_client -connect api.staging.internal:443 -tls1_3 -curves X25519MLKEM768 Inspect the output to confirm Temp Key: ML-KEM-768 + X25519 was successfully agreed upon during the TLS 1.3 handshake. Discussion Question Has your team audited packet fragmentation risks for larger PQC key exchanges on existing reverse proxies, or are you waiting for cloud ingress providers to toggle it by default? CTA (Join Techawks UK) Join the Techawks UK community to connect with local systems engineers, platform leads, and cloud architects deploying resilient, quantum-ready infrastructure.
    0 Commentarios 0 Acciones 477 Views 0 Vista previa
  • Beyond the White House Post-Quantum Cryptography Mandates: How to Implement Hybrid TLS in Your Stack


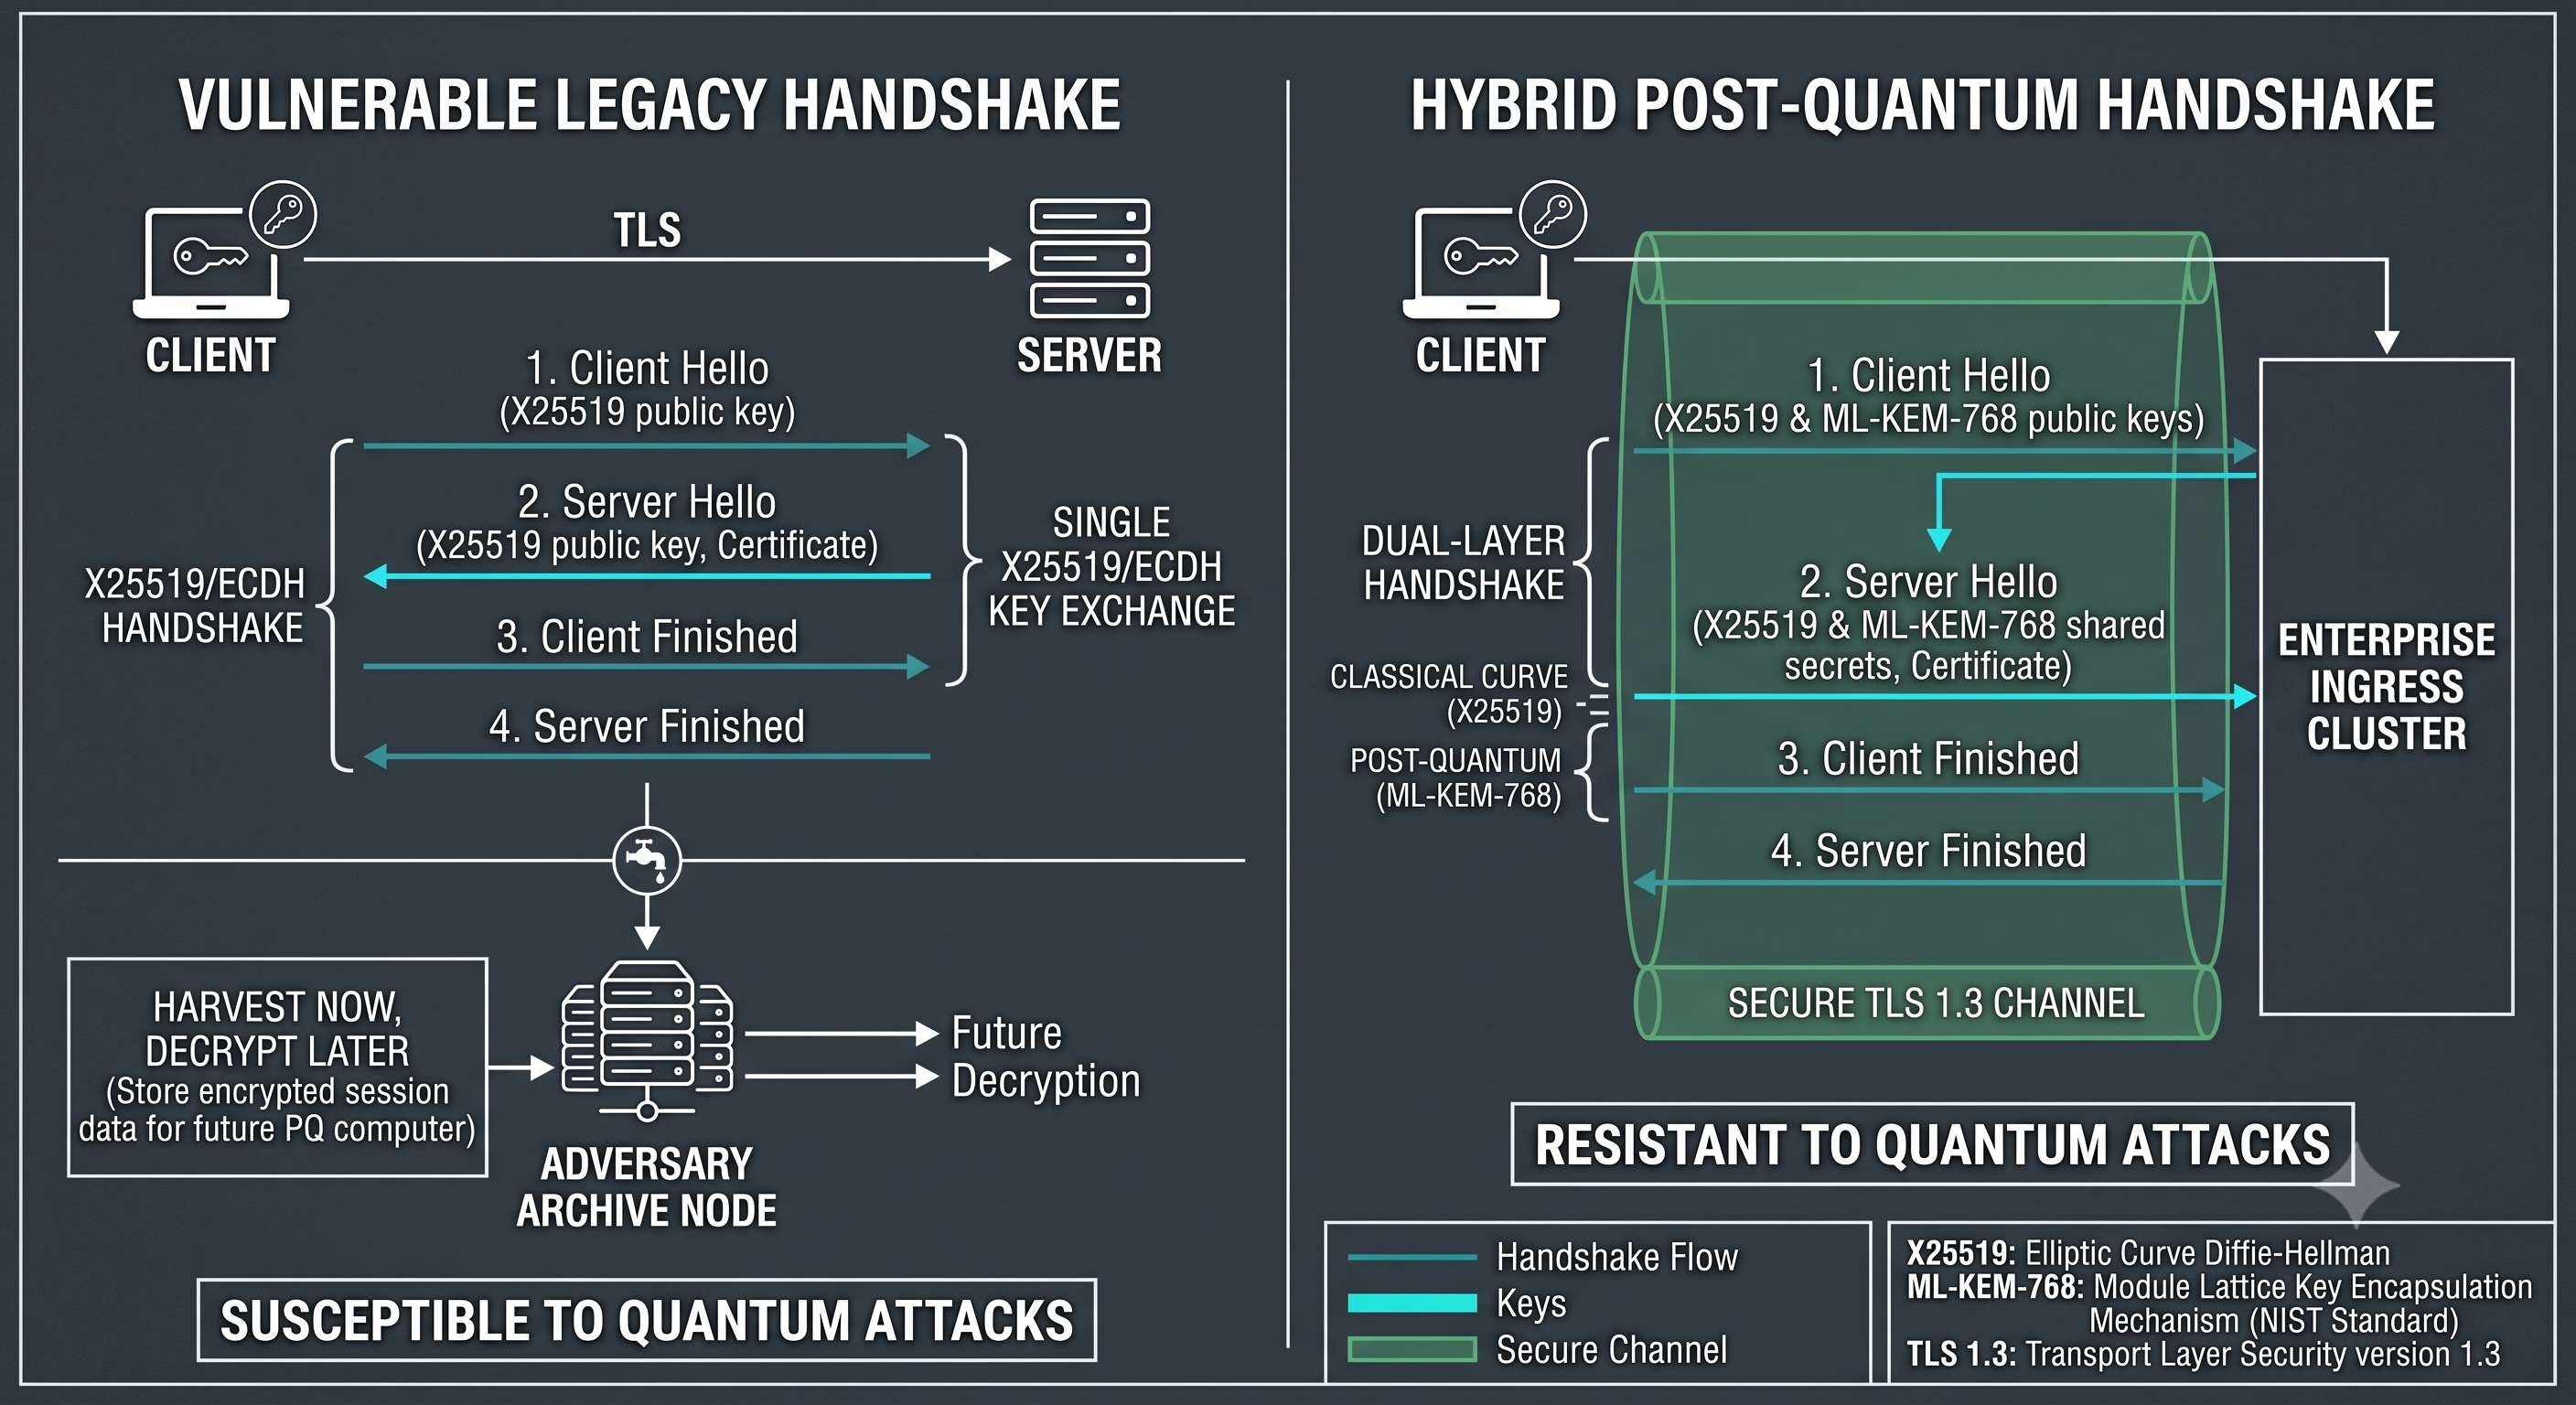
    Adversaries do not need a functional cryptographically relevant quantum computer today to compromise your enterprise data; they only need to intercept and archive encrypted traffic now and crack it once hardware catches up.


    With the Office of Management and Budget (OMB) and CISA enforcing aggressive migration milestones—and major cloud edge networks already serving post-quantum traffic by default—US platform and security engineering teams must shift to crypto-agility.


    The standard operational approach isn't an overnight rip-and-replace of RSA or ECC. It is deploying hybrid post-quantum key exchange (X25519 + ML-KEM).


    Here is the three-step pattern to introduce post-quantum resilience to your ingress and microservice boundaries today:


    1. Enable Hybrid Key Encapsulation (ML-KEM) at the Ingress Edge
    Modern TLS 1.3 supports hybrid key establishment. A hybrid handshake binds a classical algorithm (like X25519) with a post-quantum algorithm (like ML-KEM-768):
    The connection remains fully secure even if the post-quantum primitive has unexpected implementation vulnerabilities.
    The session key is protected against future quantum decryption even if the classical key exchange is eventually broken.
    Configure your reverse proxy, CDN, or gateway (e.g., Envoy, Cloudflare, AWS CloudFront) to prioritize post-quantum hybrid cipher groups (X25519MLKEM768) in the ClientHello negotiation.


    2. Audit MTU Sizes and Packet Fragmentation Limits
    Post-quantum cryptographic artifacts (keys, ciphertexts, and signatures) are significantly larger than traditional elliptic-curve parameters:
    ML-KEM keys and ciphertexts expand the initial TLS handshake size, which can push TCP payloads past standard 1500-byte MTUs.
    Benchmark internal service-to-service gRPC or mTLS meshes under post-quantum cipher suites. If middleboxes, legacy firewalls, or load balancers drop fragmented initial packets, your connections will experience silent handshake timeouts.


    3. Build a Software Inventory of Cryptographic Primitives (CBOM)
    You cannot migrate what you cannot see. Replace hardcoded cryptographic libraries across your codebase:
    Generate a Cryptography Bill of Materials (CBOM) using automated code scanners to identify every instance of hardcoded RSA-2048, ECDH, or legacy TLS configurations.


    Wrap cryptographic operations behind policy-driven service abstractions so algorithm upgrades require configuration changes rather than code rewrites.


    Discussion Question
    Has your engineering team begun testing hybrid post-quantum cipher suites on your edge reverse proxies, or is cryptographic migration still isolated to security compliance reviews?


    CTA
    Ready to build resilient, future-proof cloud infrastructure and navigate US security compliance standards?


    👉 Join the Techawks USA Community to collaborate with senior infrastructure architects, access security migration playbooks, and participate in peer-led engineering teardowns.
    Beyond the White House Post-Quantum Cryptography Mandates: How to Implement Hybrid TLS in Your Stack Adversaries do not need a functional cryptographically relevant quantum computer today to compromise your enterprise data; they only need to intercept and archive encrypted traffic now and crack it once hardware catches up. With the Office of Management and Budget (OMB) and CISA enforcing aggressive migration milestones—and major cloud edge networks already serving post-quantum traffic by default—US platform and security engineering teams must shift to crypto-agility. The standard operational approach isn't an overnight rip-and-replace of RSA or ECC. It is deploying hybrid post-quantum key exchange (X25519 + ML-KEM). Here is the three-step pattern to introduce post-quantum resilience to your ingress and microservice boundaries today: 1. Enable Hybrid Key Encapsulation (ML-KEM) at the Ingress Edge Modern TLS 1.3 supports hybrid key establishment. A hybrid handshake binds a classical algorithm (like X25519) with a post-quantum algorithm (like ML-KEM-768): The connection remains fully secure even if the post-quantum primitive has unexpected implementation vulnerabilities. The session key is protected against future quantum decryption even if the classical key exchange is eventually broken. Configure your reverse proxy, CDN, or gateway (e.g., Envoy, Cloudflare, AWS CloudFront) to prioritize post-quantum hybrid cipher groups (X25519MLKEM768) in the ClientHello negotiation. 2. Audit MTU Sizes and Packet Fragmentation Limits Post-quantum cryptographic artifacts (keys, ciphertexts, and signatures) are significantly larger than traditional elliptic-curve parameters: ML-KEM keys and ciphertexts expand the initial TLS handshake size, which can push TCP payloads past standard 1500-byte MTUs. Benchmark internal service-to-service gRPC or mTLS meshes under post-quantum cipher suites. If middleboxes, legacy firewalls, or load balancers drop fragmented initial packets, your connections will experience silent handshake timeouts. 3. Build a Software Inventory of Cryptographic Primitives (CBOM) You cannot migrate what you cannot see. Replace hardcoded cryptographic libraries across your codebase: Generate a Cryptography Bill of Materials (CBOM) using automated code scanners to identify every instance of hardcoded RSA-2048, ECDH, or legacy TLS configurations. Wrap cryptographic operations behind policy-driven service abstractions so algorithm upgrades require configuration changes rather than code rewrites. Discussion Question Has your engineering team begun testing hybrid post-quantum cipher suites on your edge reverse proxies, or is cryptographic migration still isolated to security compliance reviews? CTA Ready to build resilient, future-proof cloud infrastructure and navigate US security compliance standards? 👉 Join the Techawks USA Community to collaborate with senior infrastructure architects, access security migration playbooks, and participate in peer-led engineering teardowns.
    0 Commentarios 0 Acciones 450 Views 0 Vista previa
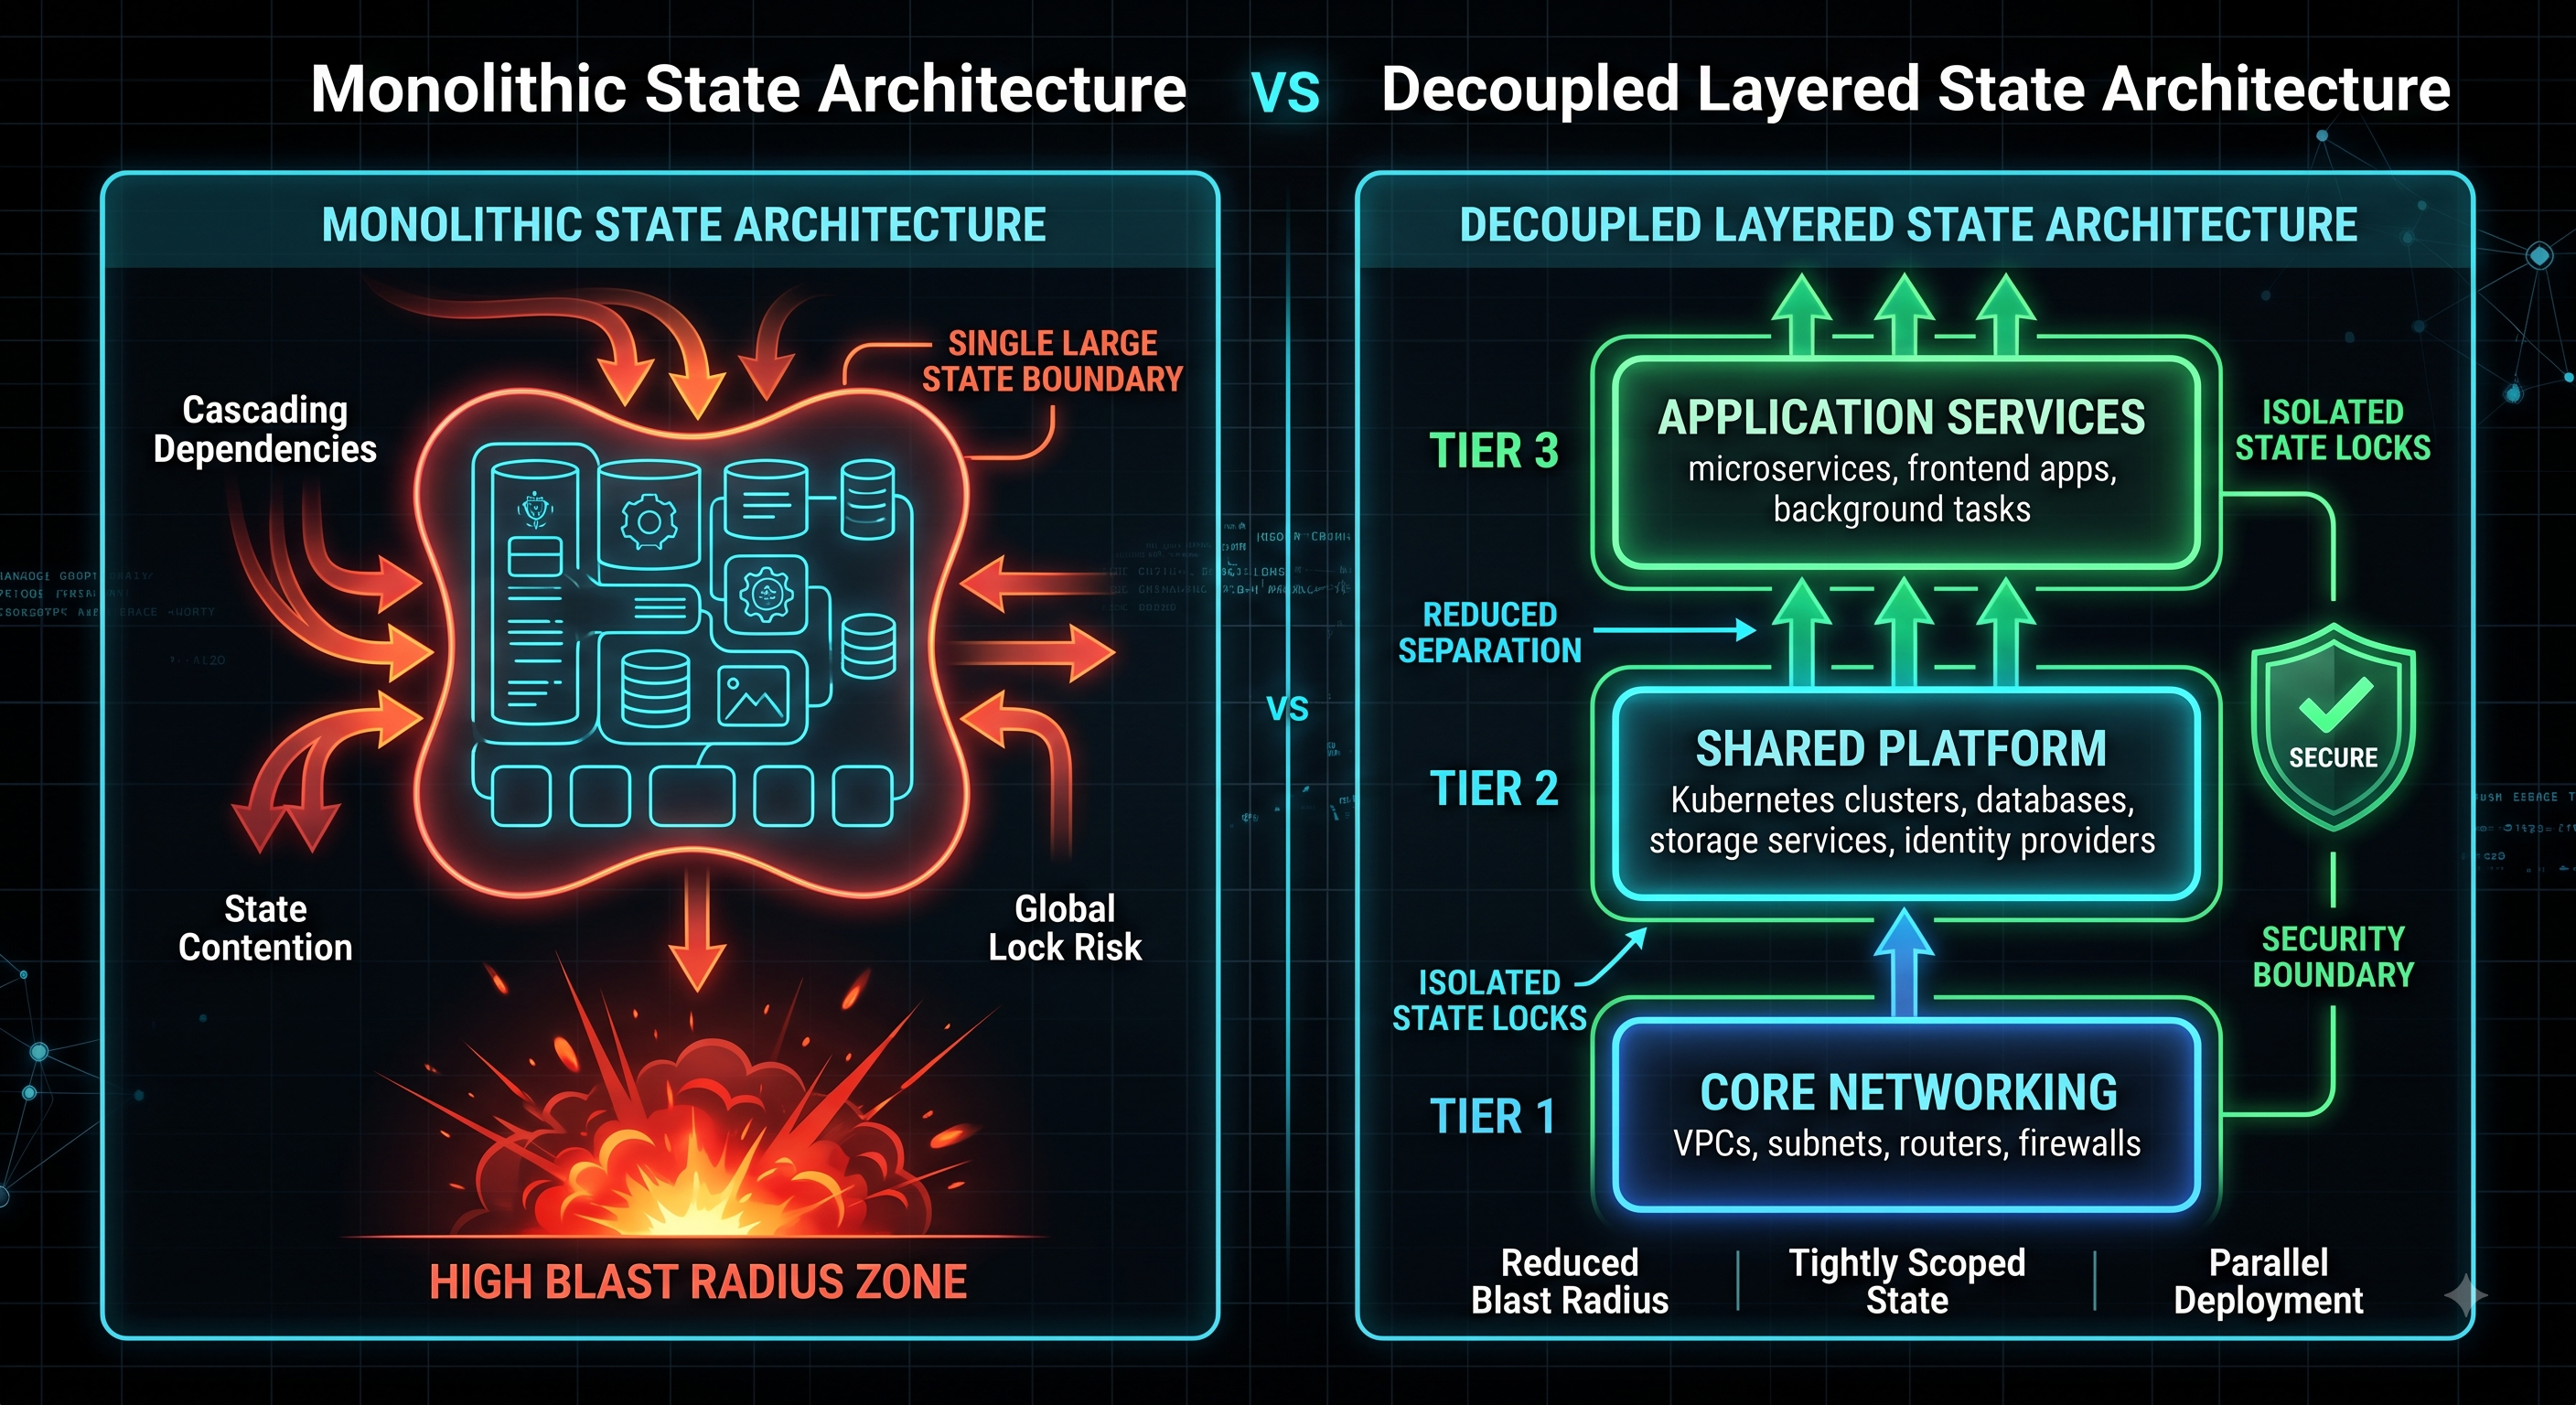
  • Monolithic Terraform vs. Micro-State Architecture: Where Do You Draw the Blast Radius Line?


    As infrastructure scales, Infrastructure as Code (IaC) architectures inevitably face a structural crossroads: do you keep environments grouped for easier reference, or decouple them into micro-states to minimize the blast radius?
    A massive, centralized state file creates lock contention across teams, slows down execution plans to a crawl, and increases the risk of accidental drift. However, over-fragmenting state files introduces dependency sprawl, complex data-sharing layers via terraform_remote_state, and orchestration friction.
    To balance safety and operational velocity, mature platform teams structure their IaC layers around stability and lifecycle frequency:


    Layer 1: Foundational / Infrequent Changes (Low Blast Risk)
    VPCs, subnets, transit gateways, and IAM base roles. These change rarely and should live in dedicated, tightly locked state files.


    Layer 2: Core Platform & Data Services (Moderate Lifecycle)
    Managed Kubernetes clusters, shared databases, and ingress gateways. Decoupled from application-level logic to prevent infrastructure rebuilds during app updates.


    Layer 3: Ephemeral & Application Workloads (High Frequency)
    Serverless functions, routing rules, deployment manifests, and autoscaling groups. Managed through autonomous states or application-scoped pipelines.
    How does your engineering team manage this trade-off?
    Do you break states down by environment, by lifecycle tier, or by domain-driven feature teams?


    Key Takeaways
    Monolithic state files drastically increase the blast radius of inadvertent configuration errors and pipeline locks.
    Over-modularizing state files can lead to complex dependency management and orchestration overhead.
    Separate state files based on resource volatility: foundational networking vs. rapidly changing application tiers.
    Restrict write permissions to foundational state backends using automated CI/CD runners rather than local developer access.


    CTA
    Want to dive deep into cloud architecture patterns, GitOps workflows, and resilient DevOps infrastructure?


    Join Techawks Cloud, DevOps & Open Source to collaborate with practicing cloud engineers, exchange IaC blueprints, and level up your platform engineering skills.
    Monolithic Terraform vs. Micro-State Architecture: Where Do You Draw the Blast Radius Line? As infrastructure scales, Infrastructure as Code (IaC) architectures inevitably face a structural crossroads: do you keep environments grouped for easier reference, or decouple them into micro-states to minimize the blast radius? A massive, centralized state file creates lock contention across teams, slows down execution plans to a crawl, and increases the risk of accidental drift. However, over-fragmenting state files introduces dependency sprawl, complex data-sharing layers via terraform_remote_state, and orchestration friction. To balance safety and operational velocity, mature platform teams structure their IaC layers around stability and lifecycle frequency: Layer 1: Foundational / Infrequent Changes (Low Blast Risk) VPCs, subnets, transit gateways, and IAM base roles. These change rarely and should live in dedicated, tightly locked state files. Layer 2: Core Platform & Data Services (Moderate Lifecycle) Managed Kubernetes clusters, shared databases, and ingress gateways. Decoupled from application-level logic to prevent infrastructure rebuilds during app updates. Layer 3: Ephemeral & Application Workloads (High Frequency) Serverless functions, routing rules, deployment manifests, and autoscaling groups. Managed through autonomous states or application-scoped pipelines. How does your engineering team manage this trade-off? Do you break states down by environment, by lifecycle tier, or by domain-driven feature teams? Key Takeaways Monolithic state files drastically increase the blast radius of inadvertent configuration errors and pipeline locks. Over-modularizing state files can lead to complex dependency management and orchestration overhead. Separate state files based on resource volatility: foundational networking vs. rapidly changing application tiers. Restrict write permissions to foundational state backends using automated CI/CD runners rather than local developer access. CTA Want to dive deep into cloud architecture patterns, GitOps workflows, and resilient DevOps infrastructure? Join Techawks Cloud, DevOps & Open Source to collaborate with practicing cloud engineers, exchange IaC blueprints, and level up your platform engineering skills.
    0 Commentarios 0 Acciones 445 Views 0 Vista previa
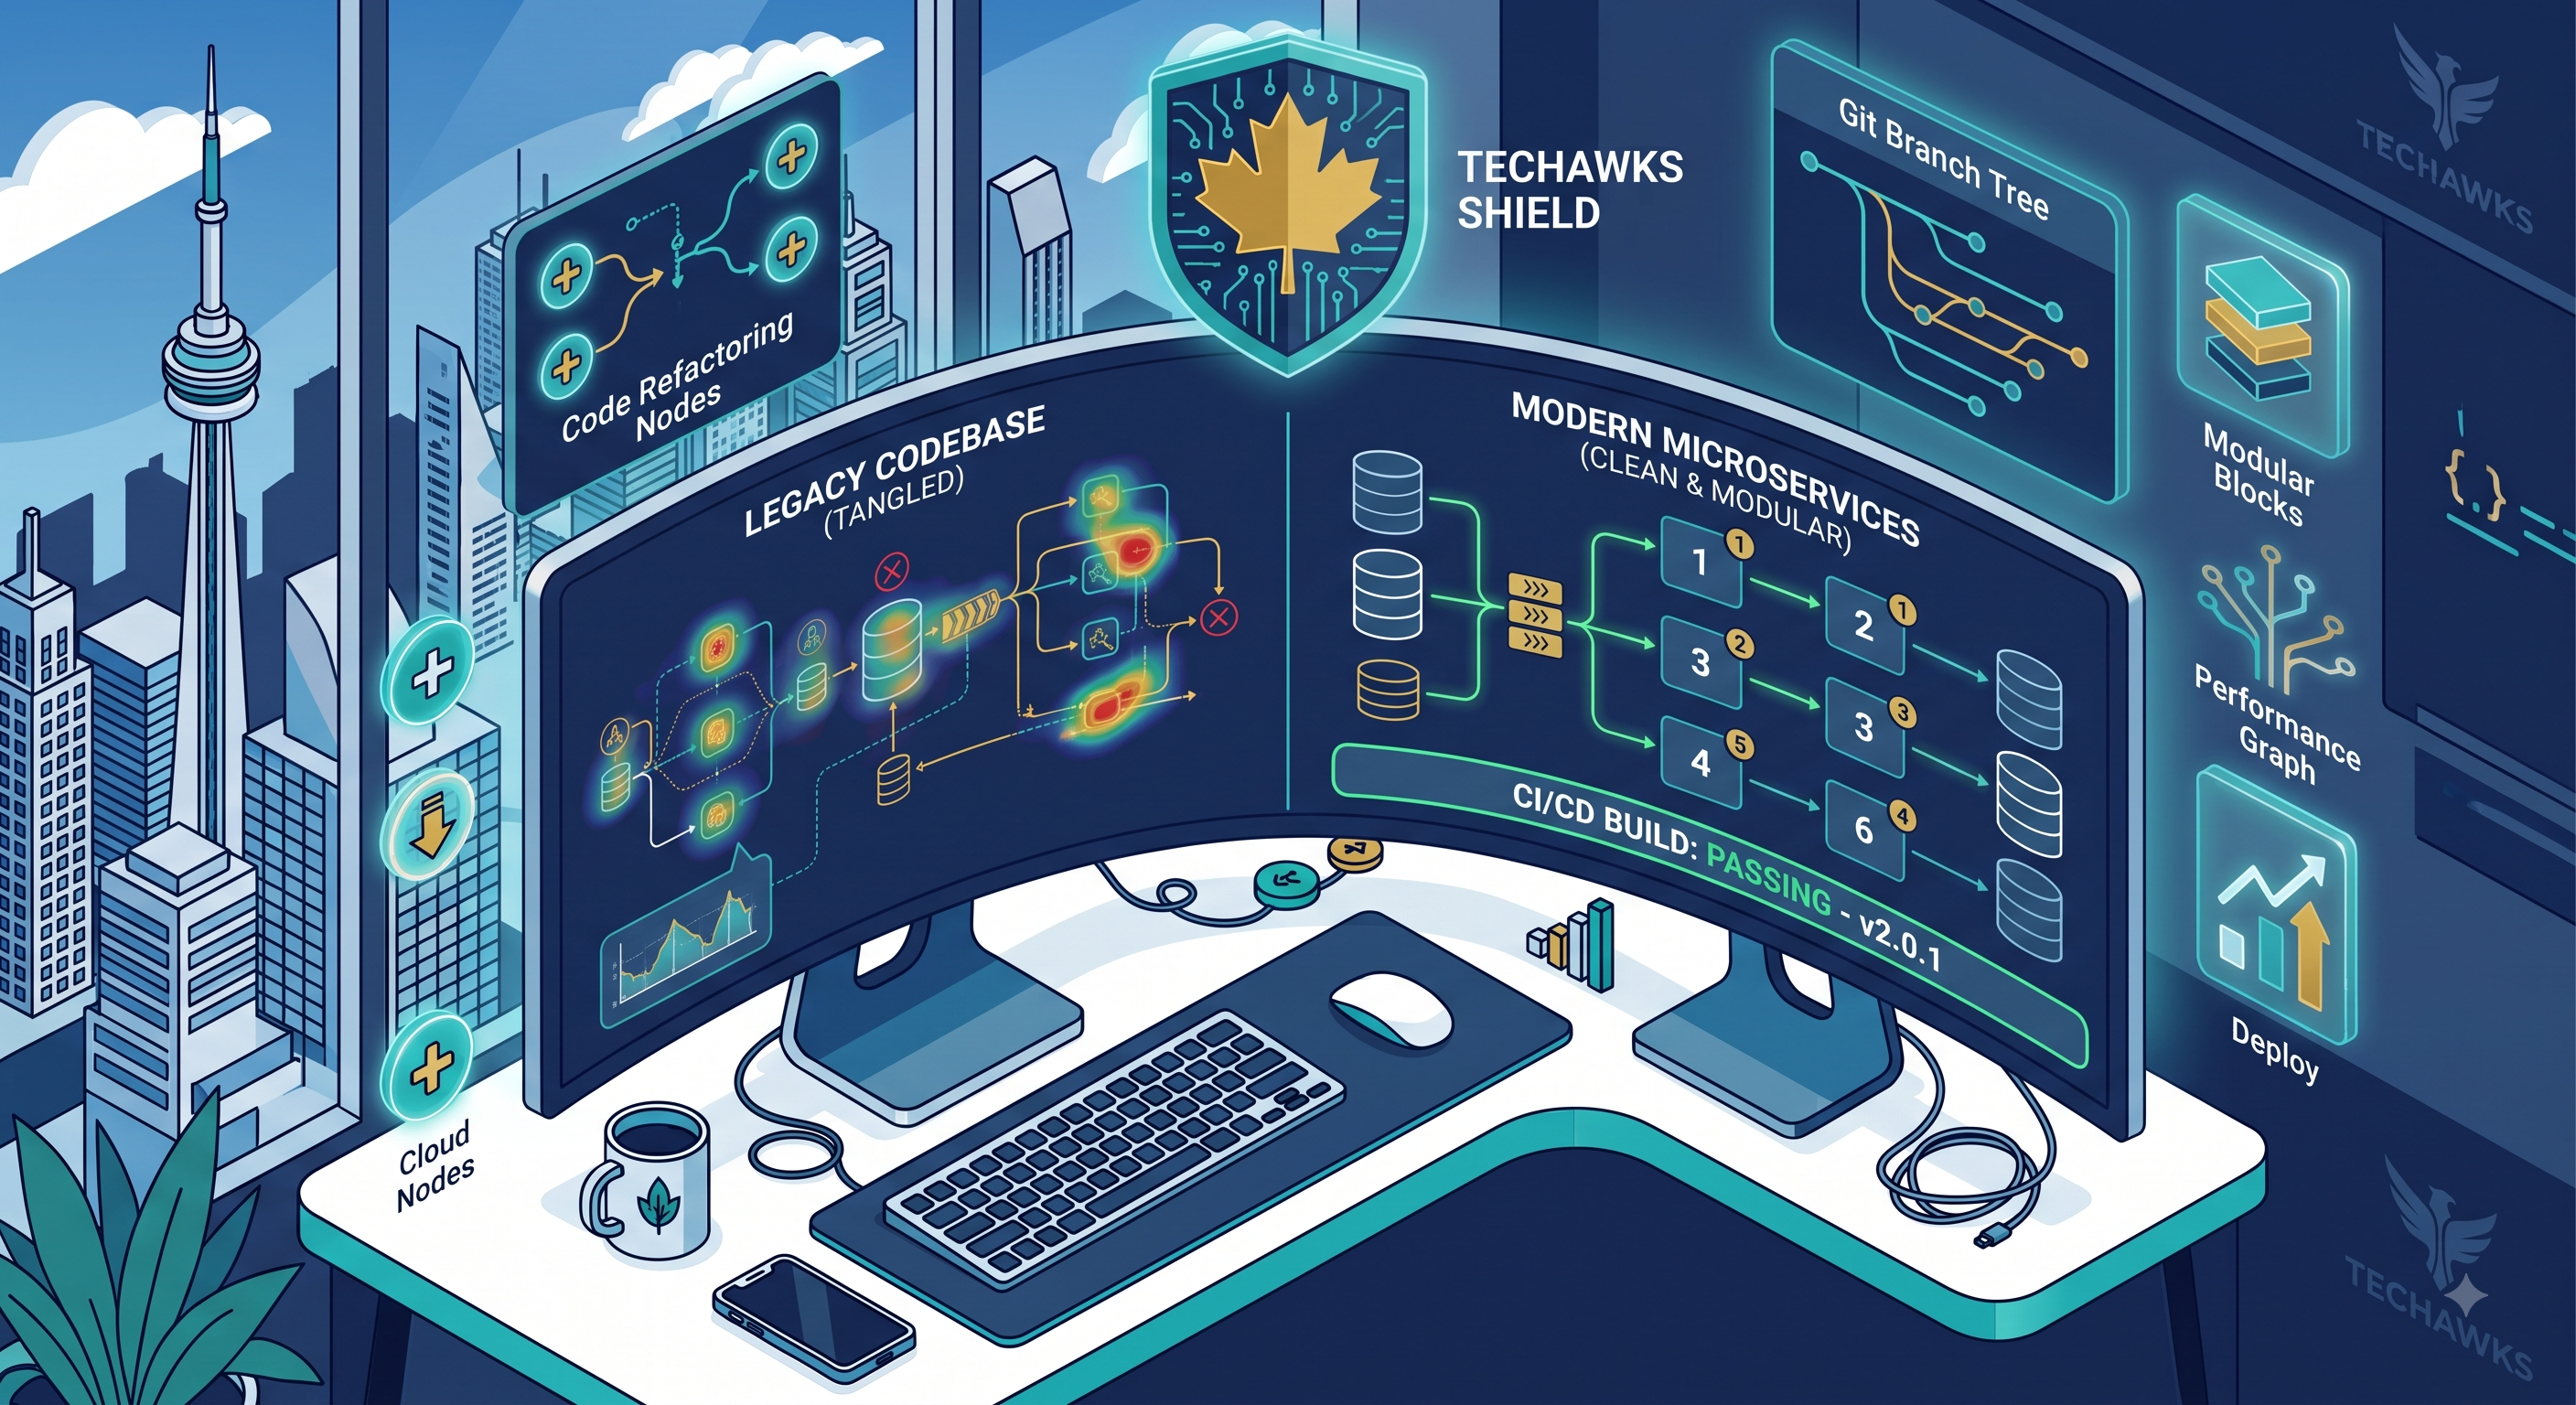
  • The 5-Step Guide to Refactoring Legacy Code Without Breaking Production


    1. Establish a Safety Net with Characterization Tests
    Before touching a single line of logic, capture the current behavior:
    Pin Current State: Write end-to-end or integration tests that record exact inputs and existing outputs—even if the current behavior includes quirks or known edge cases.
    Verify Boundaries: Run these tests across high-traffic paths to guarantee that your baseline coverage prevents unintended regressions.


    2. Apply the Strangler Fig Pattern
    Avoid the high-risk "big bang" rewrite:
    Intercept at the Boundary: Introduce an API gateway, proxy layer, or adapter in front of the legacy module.
    Migrate Incrementally: Implement new or updated features in a modular service, routing a small percentage of traffic to the new path while the old system handles the rest.
    Deprecate Systematically: Gradually shift 100% of the traffic and remove the obsolete legacy code.


    3. Decouple Database & Logic Changes
    Schema changes require separate release cycles from application code:
    Phase 1 (Expand): Add the new column, table, or schema path without modifying existing columns.
    Phase 2 (Dual-Write): Update the application to write to both the old and new storage locations.
    Phase 3 (Contract): Backfill historical data, switch application reads to the new schema, and safely remove the old database fields.


    4. Keep Pull Requests Atomic and Focused
    Separate Behavior from Structure: Never combine a pure architectural refactor (e.g., extracting classes or renaming methods) with a functional feature release or bug fix in the same pull request.
    Limit Scope: Small, self-contained PRs simplify code reviews, ease root-cause analysis, and make rollbacks straightforward if an anomaly arises.


    5. Guard Releases with Dynamic Feature Flags
    Runtime Control: Wrap new code paths in feature toggles so you can enable them for specific percentages of users or test groups.
    Instant Rollbacks: If performance metrics or error rates spike, disable the flag instantly without initiating an emergency deployment pipeline.


    Key Takeaways
    Test First: Lock in baseline behavior using characterization tests before modifying legacy code.
    Isolate Changes: Decouple architectural refactoring from new feature logic into separate, atomic PRs.
    Migrate Gradually: Use the Strangler Fig pattern and multi-phase database migrations to avoid downtime.
    Mitigate Risk: Implement feature flags to control rollout velocity and enable instant rollbacks.


    CTA
    Looking to sharpen your engineering practices, master clean architecture, and exchange real-world code solutions with developers worldwide?


    👉 Join the Techawks Community today and collaborate with engineers, architects, and builders globally.
    The 5-Step Guide to Refactoring Legacy Code Without Breaking Production 1. Establish a Safety Net with Characterization Tests Before touching a single line of logic, capture the current behavior: Pin Current State: Write end-to-end or integration tests that record exact inputs and existing outputs—even if the current behavior includes quirks or known edge cases. Verify Boundaries: Run these tests across high-traffic paths to guarantee that your baseline coverage prevents unintended regressions. 2. Apply the Strangler Fig Pattern Avoid the high-risk "big bang" rewrite: Intercept at the Boundary: Introduce an API gateway, proxy layer, or adapter in front of the legacy module. Migrate Incrementally: Implement new or updated features in a modular service, routing a small percentage of traffic to the new path while the old system handles the rest. Deprecate Systematically: Gradually shift 100% of the traffic and remove the obsolete legacy code. 3. Decouple Database & Logic Changes Schema changes require separate release cycles from application code: Phase 1 (Expand): Add the new column, table, or schema path without modifying existing columns. Phase 2 (Dual-Write): Update the application to write to both the old and new storage locations. Phase 3 (Contract): Backfill historical data, switch application reads to the new schema, and safely remove the old database fields. 4. Keep Pull Requests Atomic and Focused Separate Behavior from Structure: Never combine a pure architectural refactor (e.g., extracting classes or renaming methods) with a functional feature release or bug fix in the same pull request. Limit Scope: Small, self-contained PRs simplify code reviews, ease root-cause analysis, and make rollbacks straightforward if an anomaly arises. 5. Guard Releases with Dynamic Feature Flags Runtime Control: Wrap new code paths in feature toggles so you can enable them for specific percentages of users or test groups. Instant Rollbacks: If performance metrics or error rates spike, disable the flag instantly without initiating an emergency deployment pipeline. Key Takeaways Test First: Lock in baseline behavior using characterization tests before modifying legacy code. Isolate Changes: Decouple architectural refactoring from new feature logic into separate, atomic PRs. Migrate Gradually: Use the Strangler Fig pattern and multi-phase database migrations to avoid downtime. Mitigate Risk: Implement feature flags to control rollout velocity and enable instant rollbacks. CTA Looking to sharpen your engineering practices, master clean architecture, and exchange real-world code solutions with developers worldwide? 👉 Join the Techawks Community today and collaborate with engineers, architects, and builders globally.
    0 Commentarios 0 Acciones 86 Views 0 Vista previa
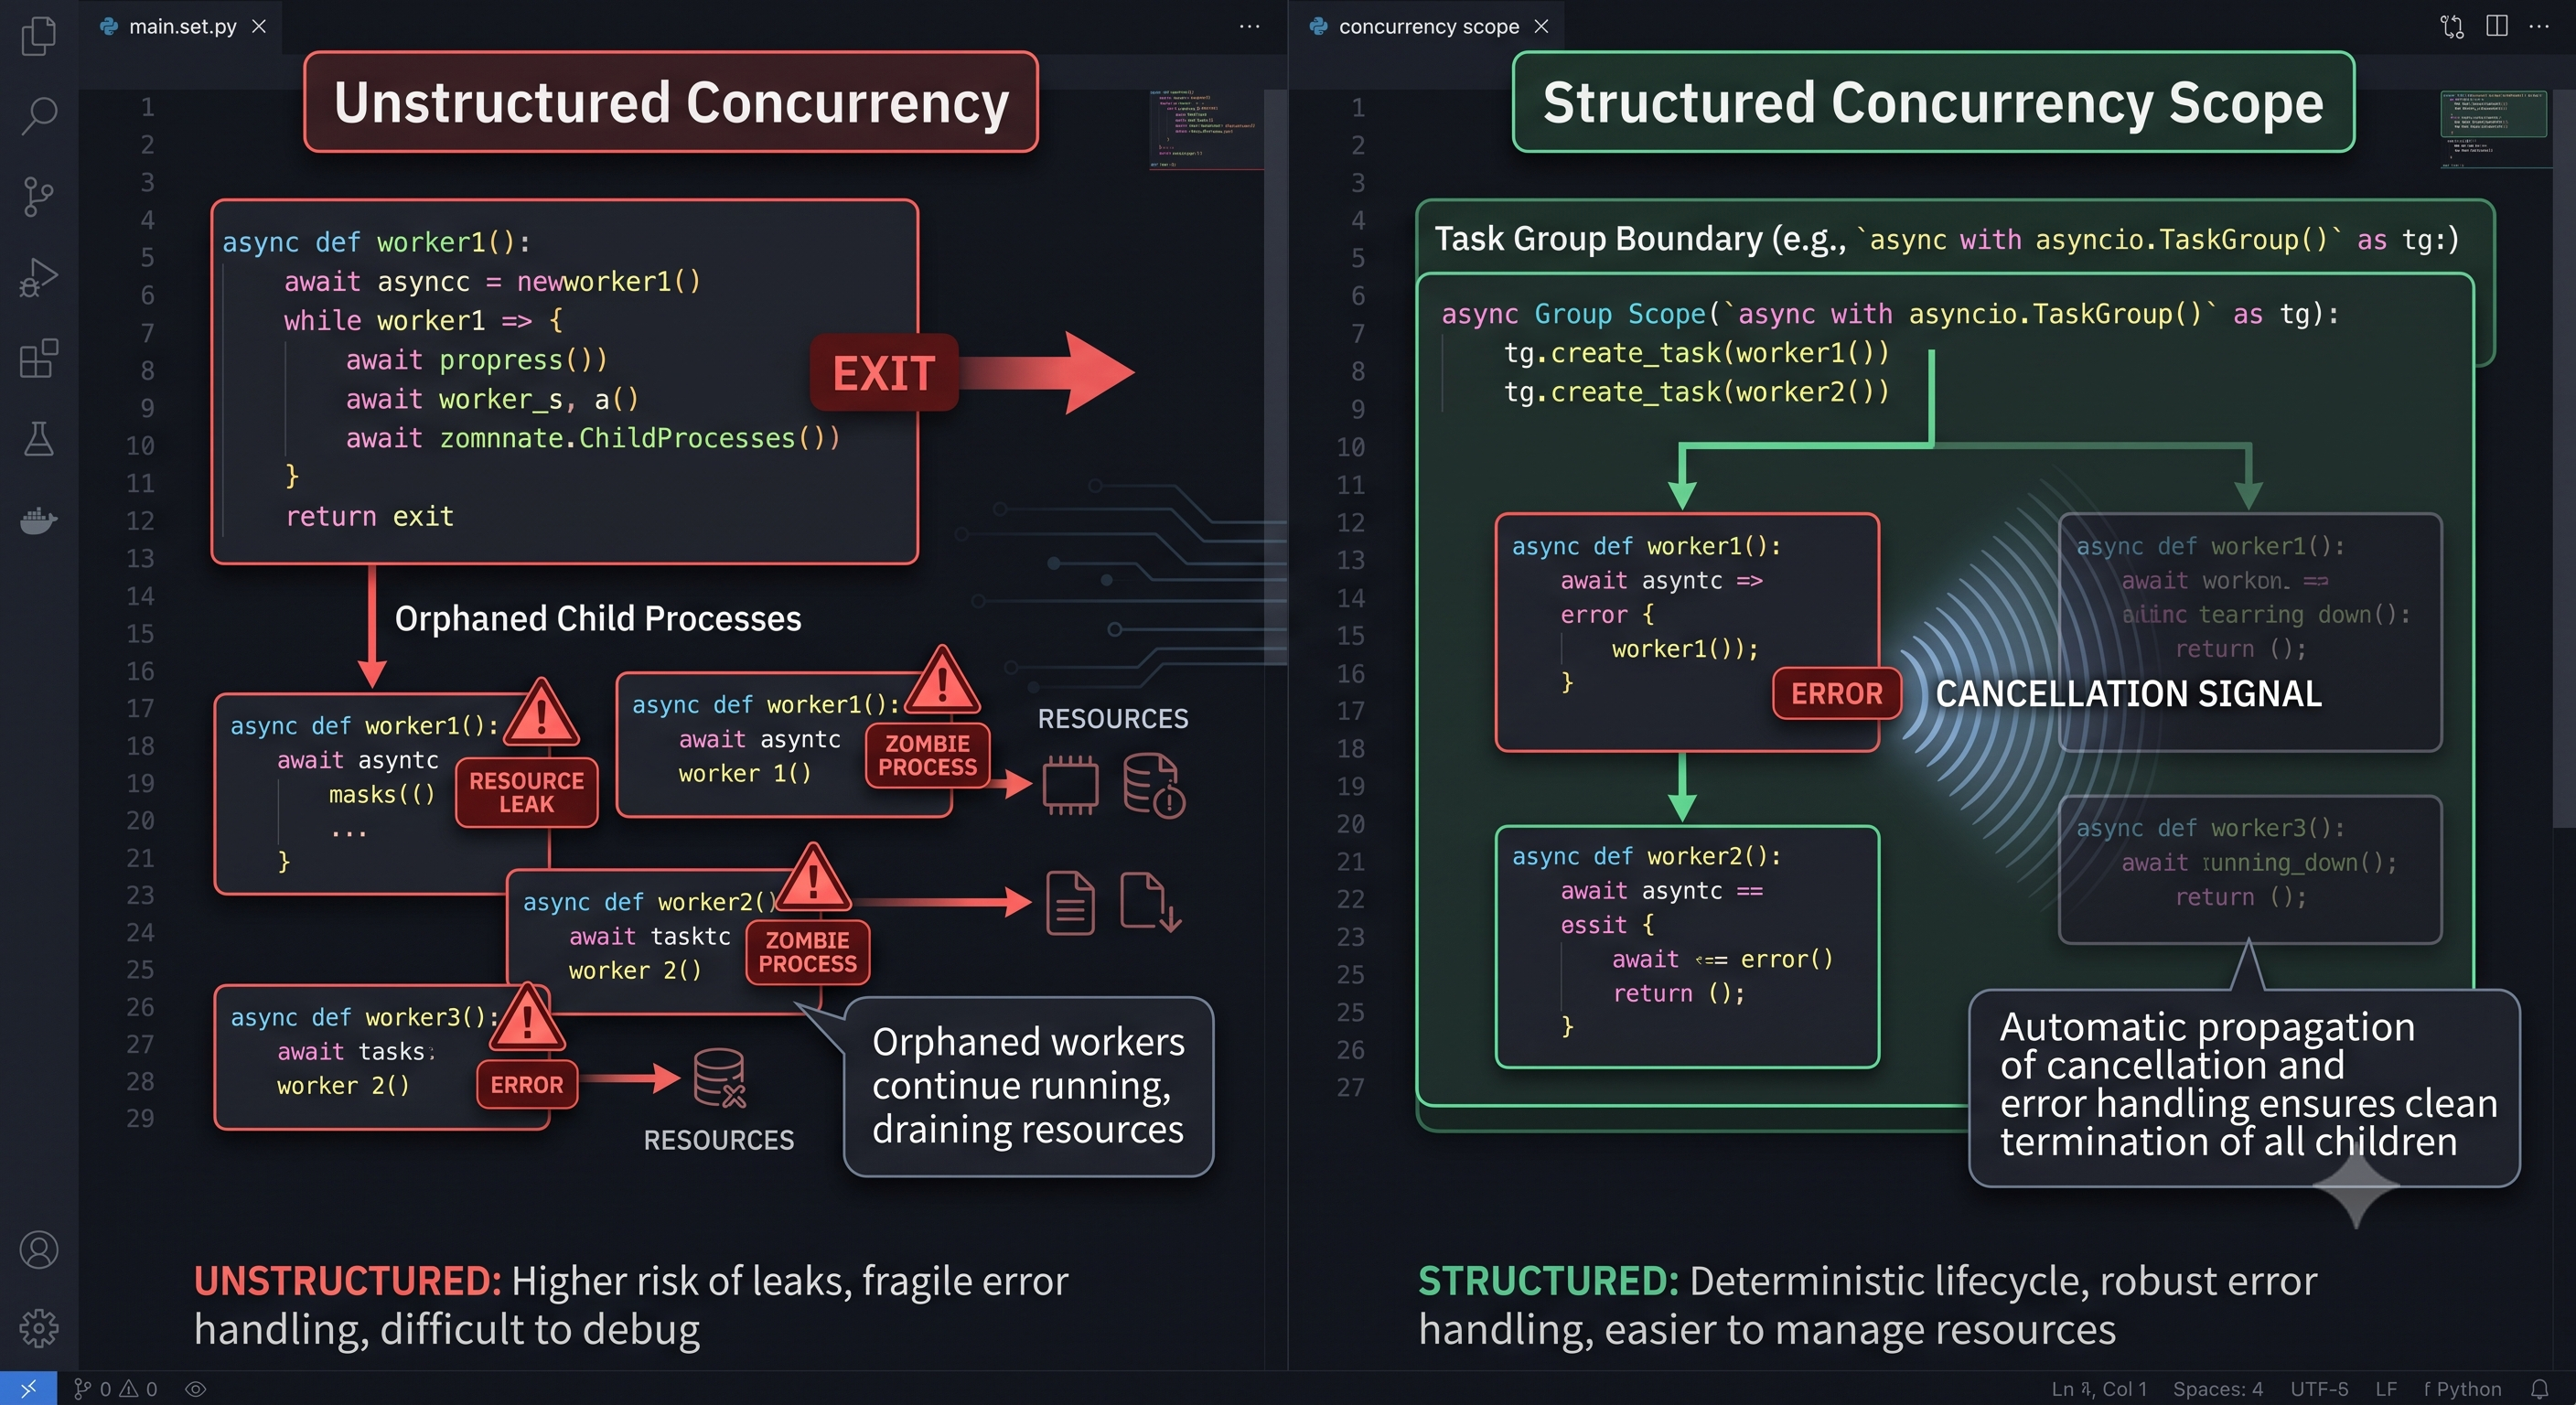
  • Structured Concurrency: The Pattern That Prevents 3 AM Goroutine and Thread Leaks


    In the early days of programming, languages used unstructured goto statements. We replaced them with structured control flow: if/else, loops, and explicit scopes.


    Yet in modern backend development, many developers still write unstructured concurrency:
    The "Goto" of Concurrency: Launching threads or coroutines (go func(), tokio::spawn, Thread.start()) with no parent-child lifecycle guarantees. If the parent function exits or throws an error, the spawned worker keeps running in the background as a zombie routine.
    Structured concurrency enforces one foundational rule: A concurrent block of work cannot complete until all its child tasks have completed or cancelled.


    The Bad Pattern vs. The Structured Pattern
    Unstructured (Orphan Risk):
    [ Parent Function ] ── spawns ──► [ Detached Task 1 ] (Runs forever if Parent fails)

    Exits ──► Task 1 is now a zombie eating memory & DB connections.


    Structured (Scoped Lifecycle):
    ┌── Structured Task Scope ────────────────────┐
    │ [ Parent Scope ] │
    │ ├── Task A (Fetch User) ──► [ Success ] │
    │ └── Task B (Fetch Orders) ──► [ FAILS / Timeout] │
    │ │
    │ * Action: Automatic cancel signal propagated to A │
    │ * Result: Scope cleans up before returning error │
    └─────────────────────────────────────┘


    3 Core Principles to Apply in Your Codebase
    Explicit Cancellation Propagation:
    Always bind child tasks to a parent cancellation token or context (context.Context in Go, CancellationToken in C#, or structured task groups in Python/Kotlin/Java). When the parent fails, children cancel immediately.
    Error Short-Circuiting:
    If Task B in a scatter-gather operation throws an unrecoverable exception, do not wait for Task A to spend 5 seconds timing out. The scope should abort sibling operations and surface the root cause instantly.
    Bounded Lifetime Guarantees:
    Ensure the stack frame that initiated the concurrent work is strictly responsible for joining and collecting errors before returning.


    Discussion Question (Poll)
    What is the most common cause of concurrency bugs in your team's production services?
    A) Deadlocks / Mutex contention
    B) Unbounded task spawning / Goroutine & thread leaks
    C) Race conditions / Unsynchronized shared state
    D) Unhandled cancellation & context timeouts
    (Drop your war stories and preferred concurrency patterns in the comments!)


    CTA
    Master clean architecture and modern backend engineering with Techawks Developers.
    Join thousands of developers writing resilient, scalable code across Go, Rust, Java, Python, and TypeScript.
    🔗 Join the Developers & Coding Community
    Structured Concurrency: The Pattern That Prevents 3 AM Goroutine and Thread Leaks In the early days of programming, languages used unstructured goto statements. We replaced them with structured control flow: if/else, loops, and explicit scopes. Yet in modern backend development, many developers still write unstructured concurrency: The "Goto" of Concurrency: Launching threads or coroutines (go func(), tokio::spawn, Thread.start()) with no parent-child lifecycle guarantees. If the parent function exits or throws an error, the spawned worker keeps running in the background as a zombie routine. Structured concurrency enforces one foundational rule: A concurrent block of work cannot complete until all its child tasks have completed or cancelled. The Bad Pattern vs. The Structured Pattern Unstructured (Orphan Risk): [ Parent Function ] ── spawns ──► [ Detached Task 1 ] (Runs forever if Parent fails) │ Exits ──► Task 1 is now a zombie eating memory & DB connections. Structured (Scoped Lifecycle): ┌── Structured Task Scope ────────────────────┐ │ [ Parent Scope ] │ │ ├── Task A (Fetch User) ──► [ Success ] │ │ └── Task B (Fetch Orders) ──► [ FAILS / Timeout] │ │ │ │ * Action: Automatic cancel signal propagated to A │ │ * Result: Scope cleans up before returning error │ └─────────────────────────────────────┘ 3 Core Principles to Apply in Your Codebase Explicit Cancellation Propagation: Always bind child tasks to a parent cancellation token or context (context.Context in Go, CancellationToken in C#, or structured task groups in Python/Kotlin/Java). When the parent fails, children cancel immediately. Error Short-Circuiting: If Task B in a scatter-gather operation throws an unrecoverable exception, do not wait for Task A to spend 5 seconds timing out. The scope should abort sibling operations and surface the root cause instantly. Bounded Lifetime Guarantees: Ensure the stack frame that initiated the concurrent work is strictly responsible for joining and collecting errors before returning. Discussion Question (Poll) What is the most common cause of concurrency bugs in your team's production services? A) Deadlocks / Mutex contention B) Unbounded task spawning / Goroutine & thread leaks C) Race conditions / Unsynchronized shared state D) Unhandled cancellation & context timeouts (Drop your war stories and preferred concurrency patterns in the comments!) CTA Master clean architecture and modern backend engineering with Techawks Developers. Join thousands of developers writing resilient, scalable code across Go, Rust, Java, Python, and TypeScript. 🔗 Join the Developers & Coding Community
    0 Commentarios 0 Acciones 100 Views 0 Vista previa
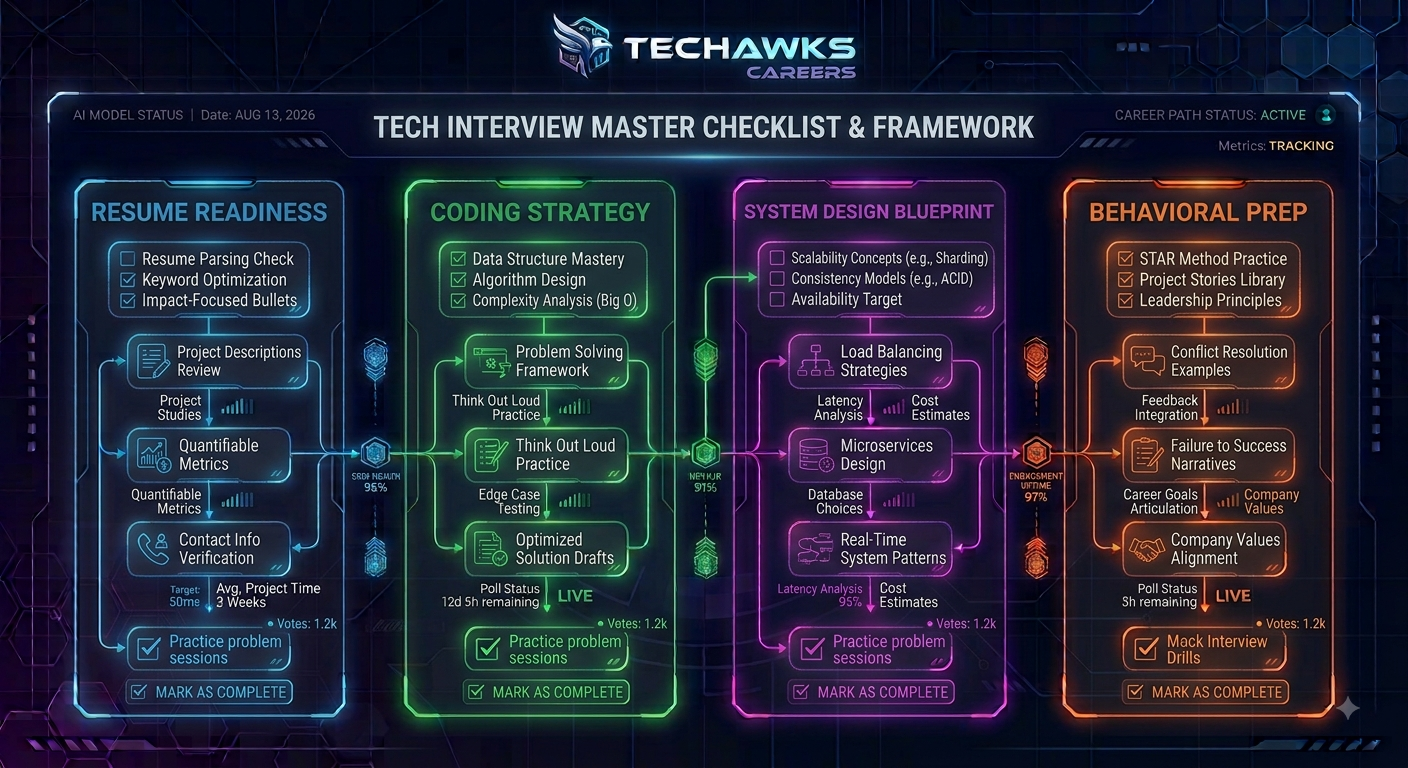
  • The Tech Interview Master Checklist: A Field-Tested Framework for Engineering Candidates
    Navigating modern tech interview loops can feel overwhelming without a structured game plan. Whether you are aiming for a software engineer, systems architect, or engineering manager role, success relies on repeatable frameworks across each stage of the hiring loop.
    Bookmark this 4-step checklist to guide your preparation before your next interview round:


    1. Resume & Application Readiness
    Quantify Results: Ensure every bullet point follows the XYZ Pattern: "Accomplished [X], as measured by [Y], by doing [Z]."
    Optimize for ATS: Use clean, single-column Markdown/PDF formats with standardized headers (Work Experience, Skills, Education) to avoid parsing glitches.
    Link Proof of Work: Hyperlink your GitHub, personal blog, or live deployments directly in your header section.


    2. Coding & Algorithmic Rounds
    Clarify Constraints First: Never jump straight into writing code. Ask about input size, edge cases (e.g., null values, duplicates), and memory/time complexity targets.
    Think Out Loud: Talk through your brute-force approach before optimizing. Interviewers grade your problem-solving process as much as your final solution.
    Validate with Test Cases: Manually trace your code with sample inputs, boundary conditions, and edge cases before declaring completion.


    3. System Design & Architecture
    Define Requirements: Establish functional requirements (e.g., core features) and non-functional requirements (e.g., latency limits, availability target, throughput).
    Estimate Scale: Do quick back-of-the-envelope calculations for read/write volume, bandwidth, and storage capacity.
    Address Bottlenecks: Proactively discuss single points of failure, database sharding, caching strategies, and circuit breakers.


    4. Behavioral & Leadership Execution
    Use the STAR Method: Frame answers using Situation, Task, Action, and Result. Focus 70% of your time on your specific actions and measurable outcomes.Prepare Story Blocks:
    Prepare 5–6 versatile stories covering technical failure, conflict resolution, project leadership, and handling tight deadlines.


    key Takeaways
    Structure Eliminates Stress: Standardized frameworks (STAR method, system design templates) keep you calm and articulate under time constraints.
    Process Over Syntax: Demonstrating clear reasoning, active communication, and trade-off evaluation matters more than writing flawless code on the first attempt.
    Measure and Iterate: Use post-interview debriefs to document questions you struggled with and refine your checklist for future rounds.


    CTA
    Preparing for upcoming technical interviews or looking for personalized portfolio reviews? Join Tech Jobs & Opportunities today to access mock interview groups, review system design blueprints, and land your next engineering role.
    The Tech Interview Master Checklist: A Field-Tested Framework for Engineering Candidates Navigating modern tech interview loops can feel overwhelming without a structured game plan. Whether you are aiming for a software engineer, systems architect, or engineering manager role, success relies on repeatable frameworks across each stage of the hiring loop. Bookmark this 4-step checklist to guide your preparation before your next interview round: 1. Resume & Application Readiness Quantify Results: Ensure every bullet point follows the XYZ Pattern: "Accomplished [X], as measured by [Y], by doing [Z]." Optimize for ATS: Use clean, single-column Markdown/PDF formats with standardized headers (Work Experience, Skills, Education) to avoid parsing glitches. Link Proof of Work: Hyperlink your GitHub, personal blog, or live deployments directly in your header section. 2. Coding & Algorithmic Rounds Clarify Constraints First: Never jump straight into writing code. Ask about input size, edge cases (e.g., null values, duplicates), and memory/time complexity targets. Think Out Loud: Talk through your brute-force approach before optimizing. Interviewers grade your problem-solving process as much as your final solution. Validate with Test Cases: Manually trace your code with sample inputs, boundary conditions, and edge cases before declaring completion. 3. System Design & Architecture Define Requirements: Establish functional requirements (e.g., core features) and non-functional requirements (e.g., latency limits, availability target, throughput). Estimate Scale: Do quick back-of-the-envelope calculations for read/write volume, bandwidth, and storage capacity. Address Bottlenecks: Proactively discuss single points of failure, database sharding, caching strategies, and circuit breakers. 4. Behavioral & Leadership Execution Use the STAR Method: Frame answers using Situation, Task, Action, and Result. Focus 70% of your time on your specific actions and measurable outcomes.Prepare Story Blocks: Prepare 5–6 versatile stories covering technical failure, conflict resolution, project leadership, and handling tight deadlines. key Takeaways Structure Eliminates Stress: Standardized frameworks (STAR method, system design templates) keep you calm and articulate under time constraints. Process Over Syntax: Demonstrating clear reasoning, active communication, and trade-off evaluation matters more than writing flawless code on the first attempt. Measure and Iterate: Use post-interview debriefs to document questions you struggled with and refine your checklist for future rounds. CTA Preparing for upcoming technical interviews or looking for personalized portfolio reviews? Join Tech Jobs & Opportunities today to access mock interview groups, review system design blueprints, and land your next engineering role.
    0 Commentarios 0 Acciones 135 Views 0 Vista previa
  • Why Copy-Pasting AI Code Is Slowing Your Learning Down (And the "Reverse Code Review" Technique)


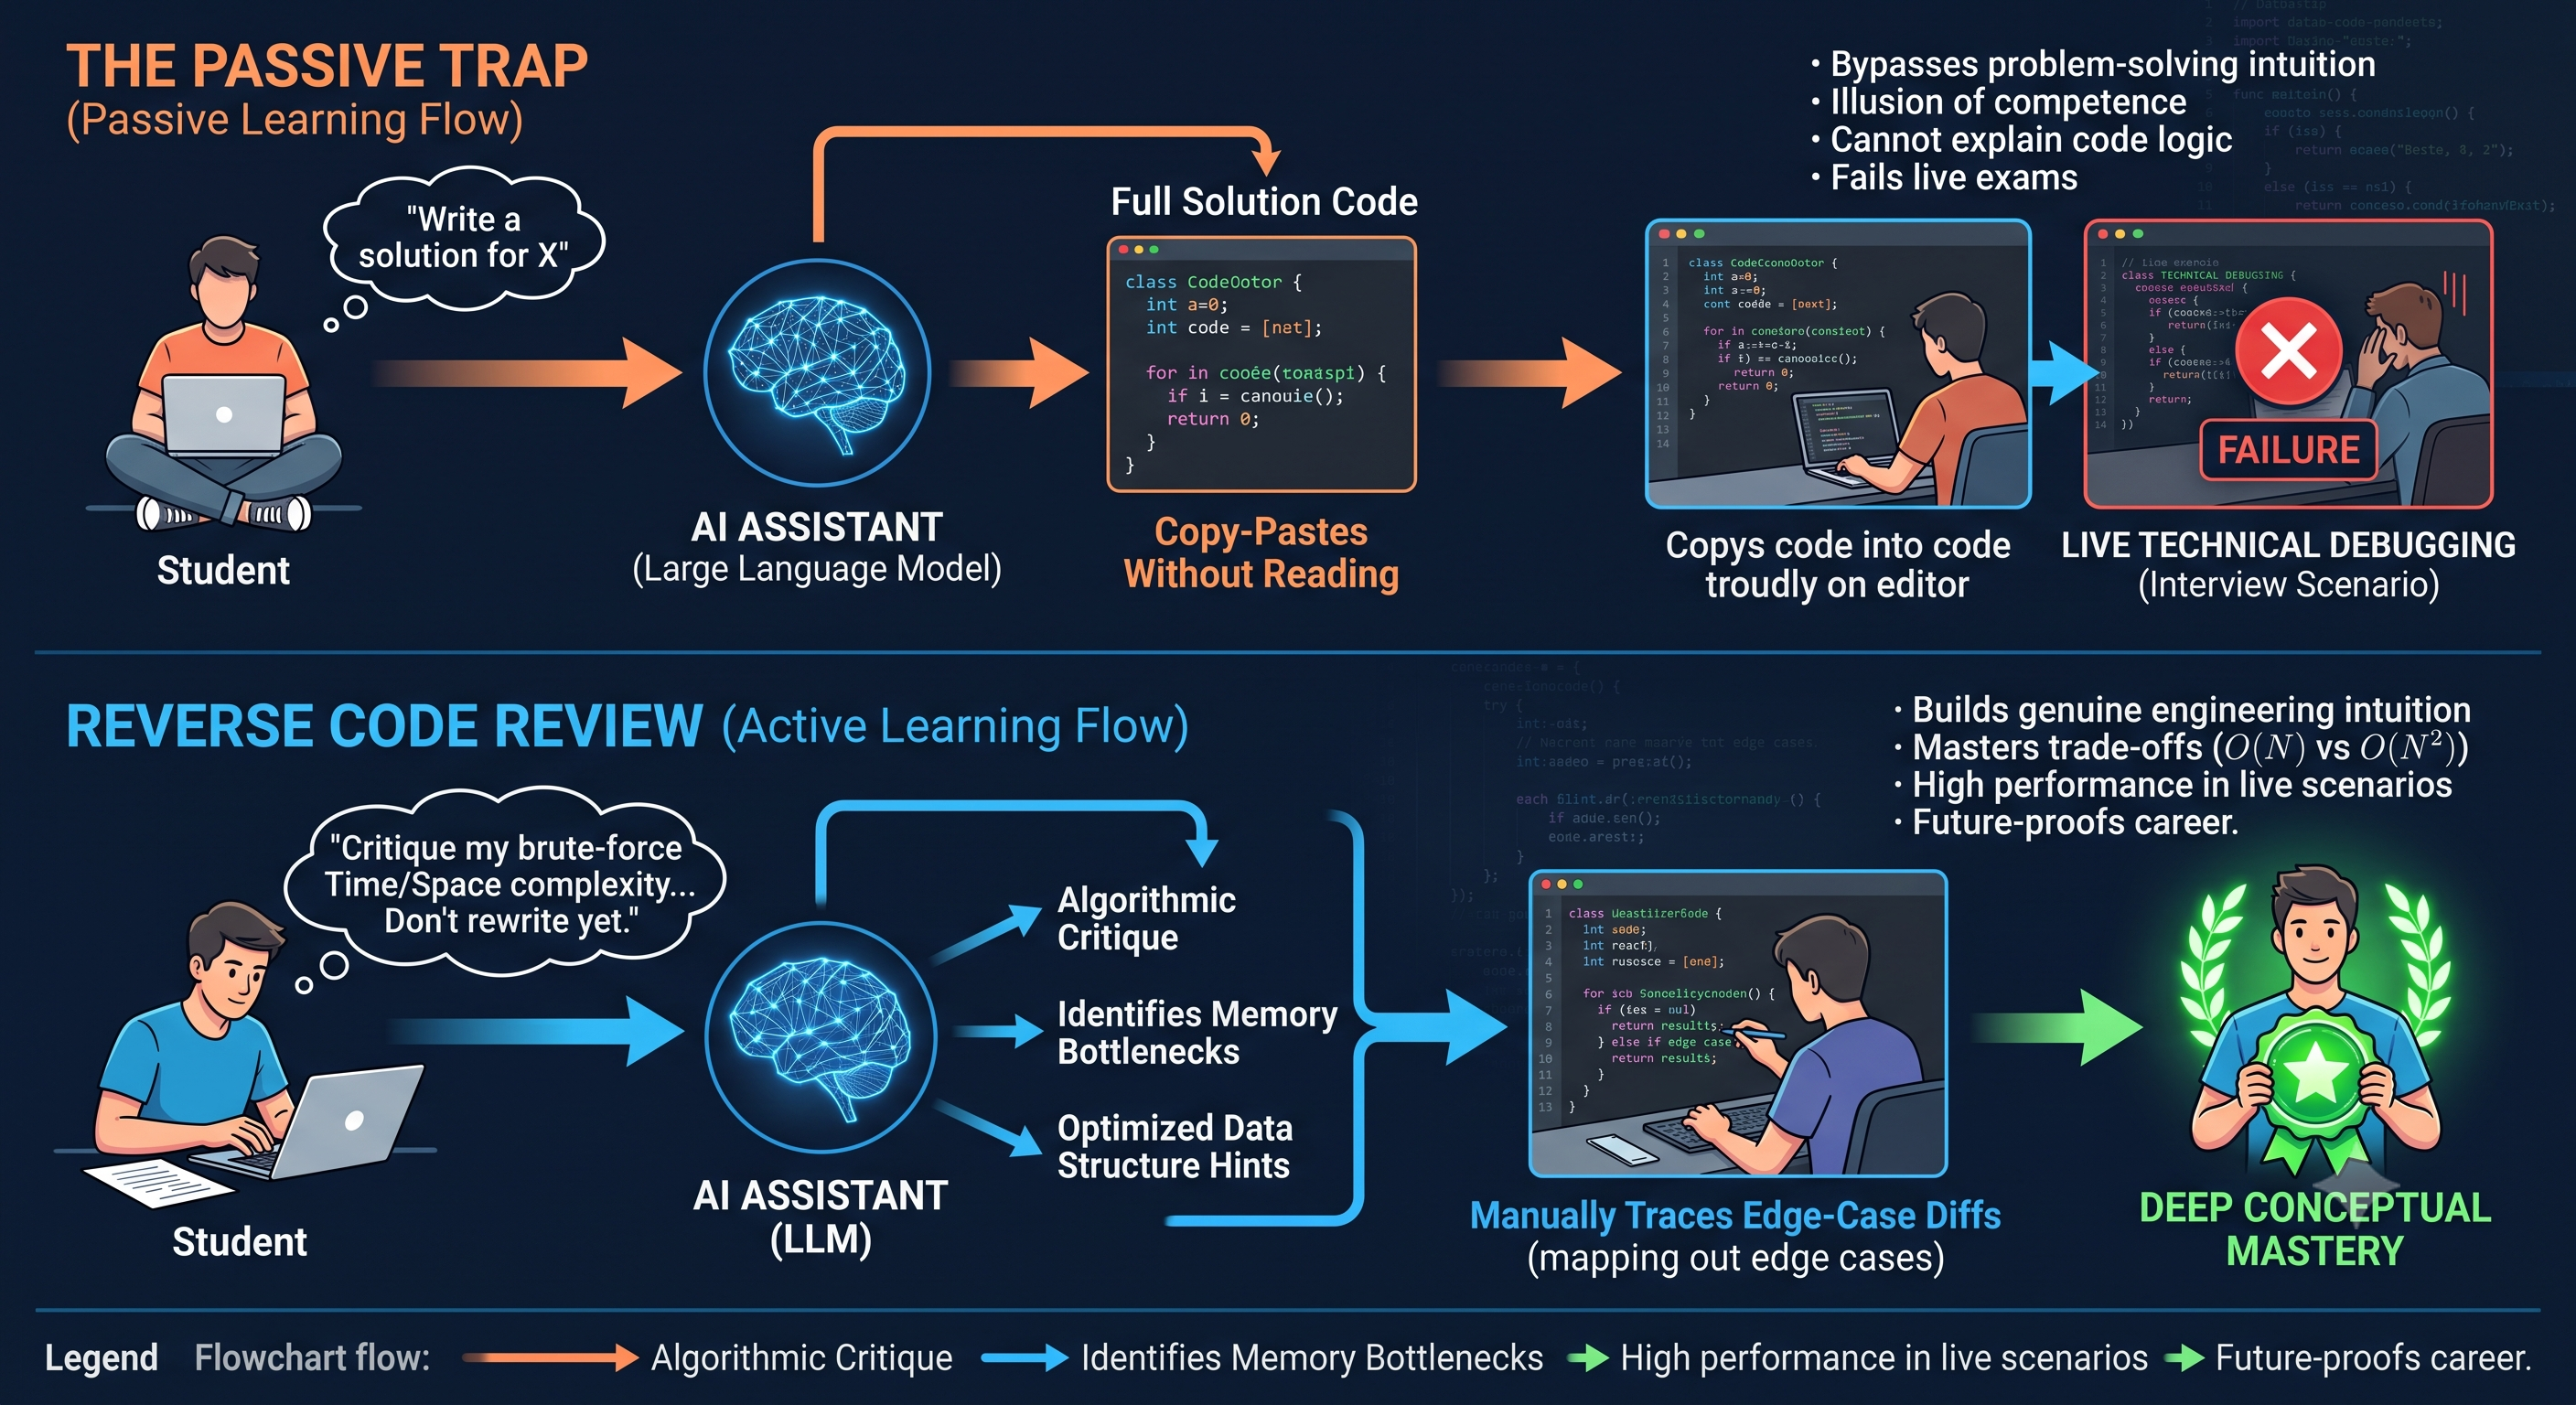
    When you let an AI write code for a problem you haven't solved yourself, you experience the Illusion of Competence: reading working code feels easy, but producing it from a blank file remains impossible.
    To build genuine engineering intuition while still leveraging modern tools, flip the workflow:


    The Reverse Code Review Framework
    Write the Naive Implementation First: Solve the problem yourself using basic loops, brute force, or pseudocode—without touching AI.
    Prompt for Code Review, Not Code Generation: Instead of prompting "Write a solution for X", prompt:
    "Here is my brute-force solution in Python. Do not rewrite it yet. Critique my Time/Space complexity ($O(N)$), identify memory bottlenecks, and hint at which data structure reduces the lookup time."
    Trace the Diff by Hand: When the AI suggests an optimized pattern (e.g., swapping a nested loop for a Hash Map or Two-Pointer approach), write down the step-by-step memory state for 3 test inputs before running the code.
    The "Explain-Back" Verification: Ask the model to generate 2 hidden edge cases designed to break your updated code. Debug those failures manually.


    The Student Takeaway:
    Treat AI like a senior engineer conducting a pull request review on your work, not an automated ghostwriter. Your competitive edge as a student isn't typing speed—it's mental models and debugging ability.


    Discussion Question & Poll
    How do you currently integrate AI tools into your daily coding and study routine?
    📊 A) Interactive Tutor (Asking for conceptual explanations & mental models)
    📊 B) Code Reviewer & Debugger (Fixing errors & optimizing my own code)
    📊 C) Rapid Prototyping (Generating boilerplate & scaffolding)
    📊 D) Solution Generator (Writing functions directly from problem prompts)
    What is the most effective prompt you use to study complex algorithms? Share it in the comments!


    Call to Action (CTA)
    Ready to master core computer science fundamentals, build standout projects, and level up alongside ambitious peers?


    👉 Join Students in Tech to access peer study groups, live coding challenges, and student developer resources.
    Why Copy-Pasting AI Code Is Slowing Your Learning Down (And the "Reverse Code Review" Technique) When you let an AI write code for a problem you haven't solved yourself, you experience the Illusion of Competence: reading working code feels easy, but producing it from a blank file remains impossible. To build genuine engineering intuition while still leveraging modern tools, flip the workflow: The Reverse Code Review Framework Write the Naive Implementation First: Solve the problem yourself using basic loops, brute force, or pseudocode—without touching AI. Prompt for Code Review, Not Code Generation: Instead of prompting "Write a solution for X", prompt: "Here is my brute-force solution in Python. Do not rewrite it yet. Critique my Time/Space complexity ($O(N)$), identify memory bottlenecks, and hint at which data structure reduces the lookup time." Trace the Diff by Hand: When the AI suggests an optimized pattern (e.g., swapping a nested loop for a Hash Map or Two-Pointer approach), write down the step-by-step memory state for 3 test inputs before running the code. The "Explain-Back" Verification: Ask the model to generate 2 hidden edge cases designed to break your updated code. Debug those failures manually. The Student Takeaway: Treat AI like a senior engineer conducting a pull request review on your work, not an automated ghostwriter. Your competitive edge as a student isn't typing speed—it's mental models and debugging ability. Discussion Question & Poll How do you currently integrate AI tools into your daily coding and study routine? 📊 A) Interactive Tutor (Asking for conceptual explanations & mental models) 📊 B) Code Reviewer & Debugger (Fixing errors & optimizing my own code) 📊 C) Rapid Prototyping (Generating boilerplate & scaffolding) 📊 D) Solution Generator (Writing functions directly from problem prompts) What is the most effective prompt you use to study complex algorithms? Share it in the comments! Call to Action (CTA) Ready to master core computer science fundamentals, build standout projects, and level up alongside ambitious peers? 👉 Join Students in Tech to access peer study groups, live coding challenges, and student developer resources.
    0 Commentarios 0 Acciones 136 Views 0 Vista previa
  • Tool Review: DuckDB + Apache Iceberg & The Death of the "Spark-for-Everything" Reflex


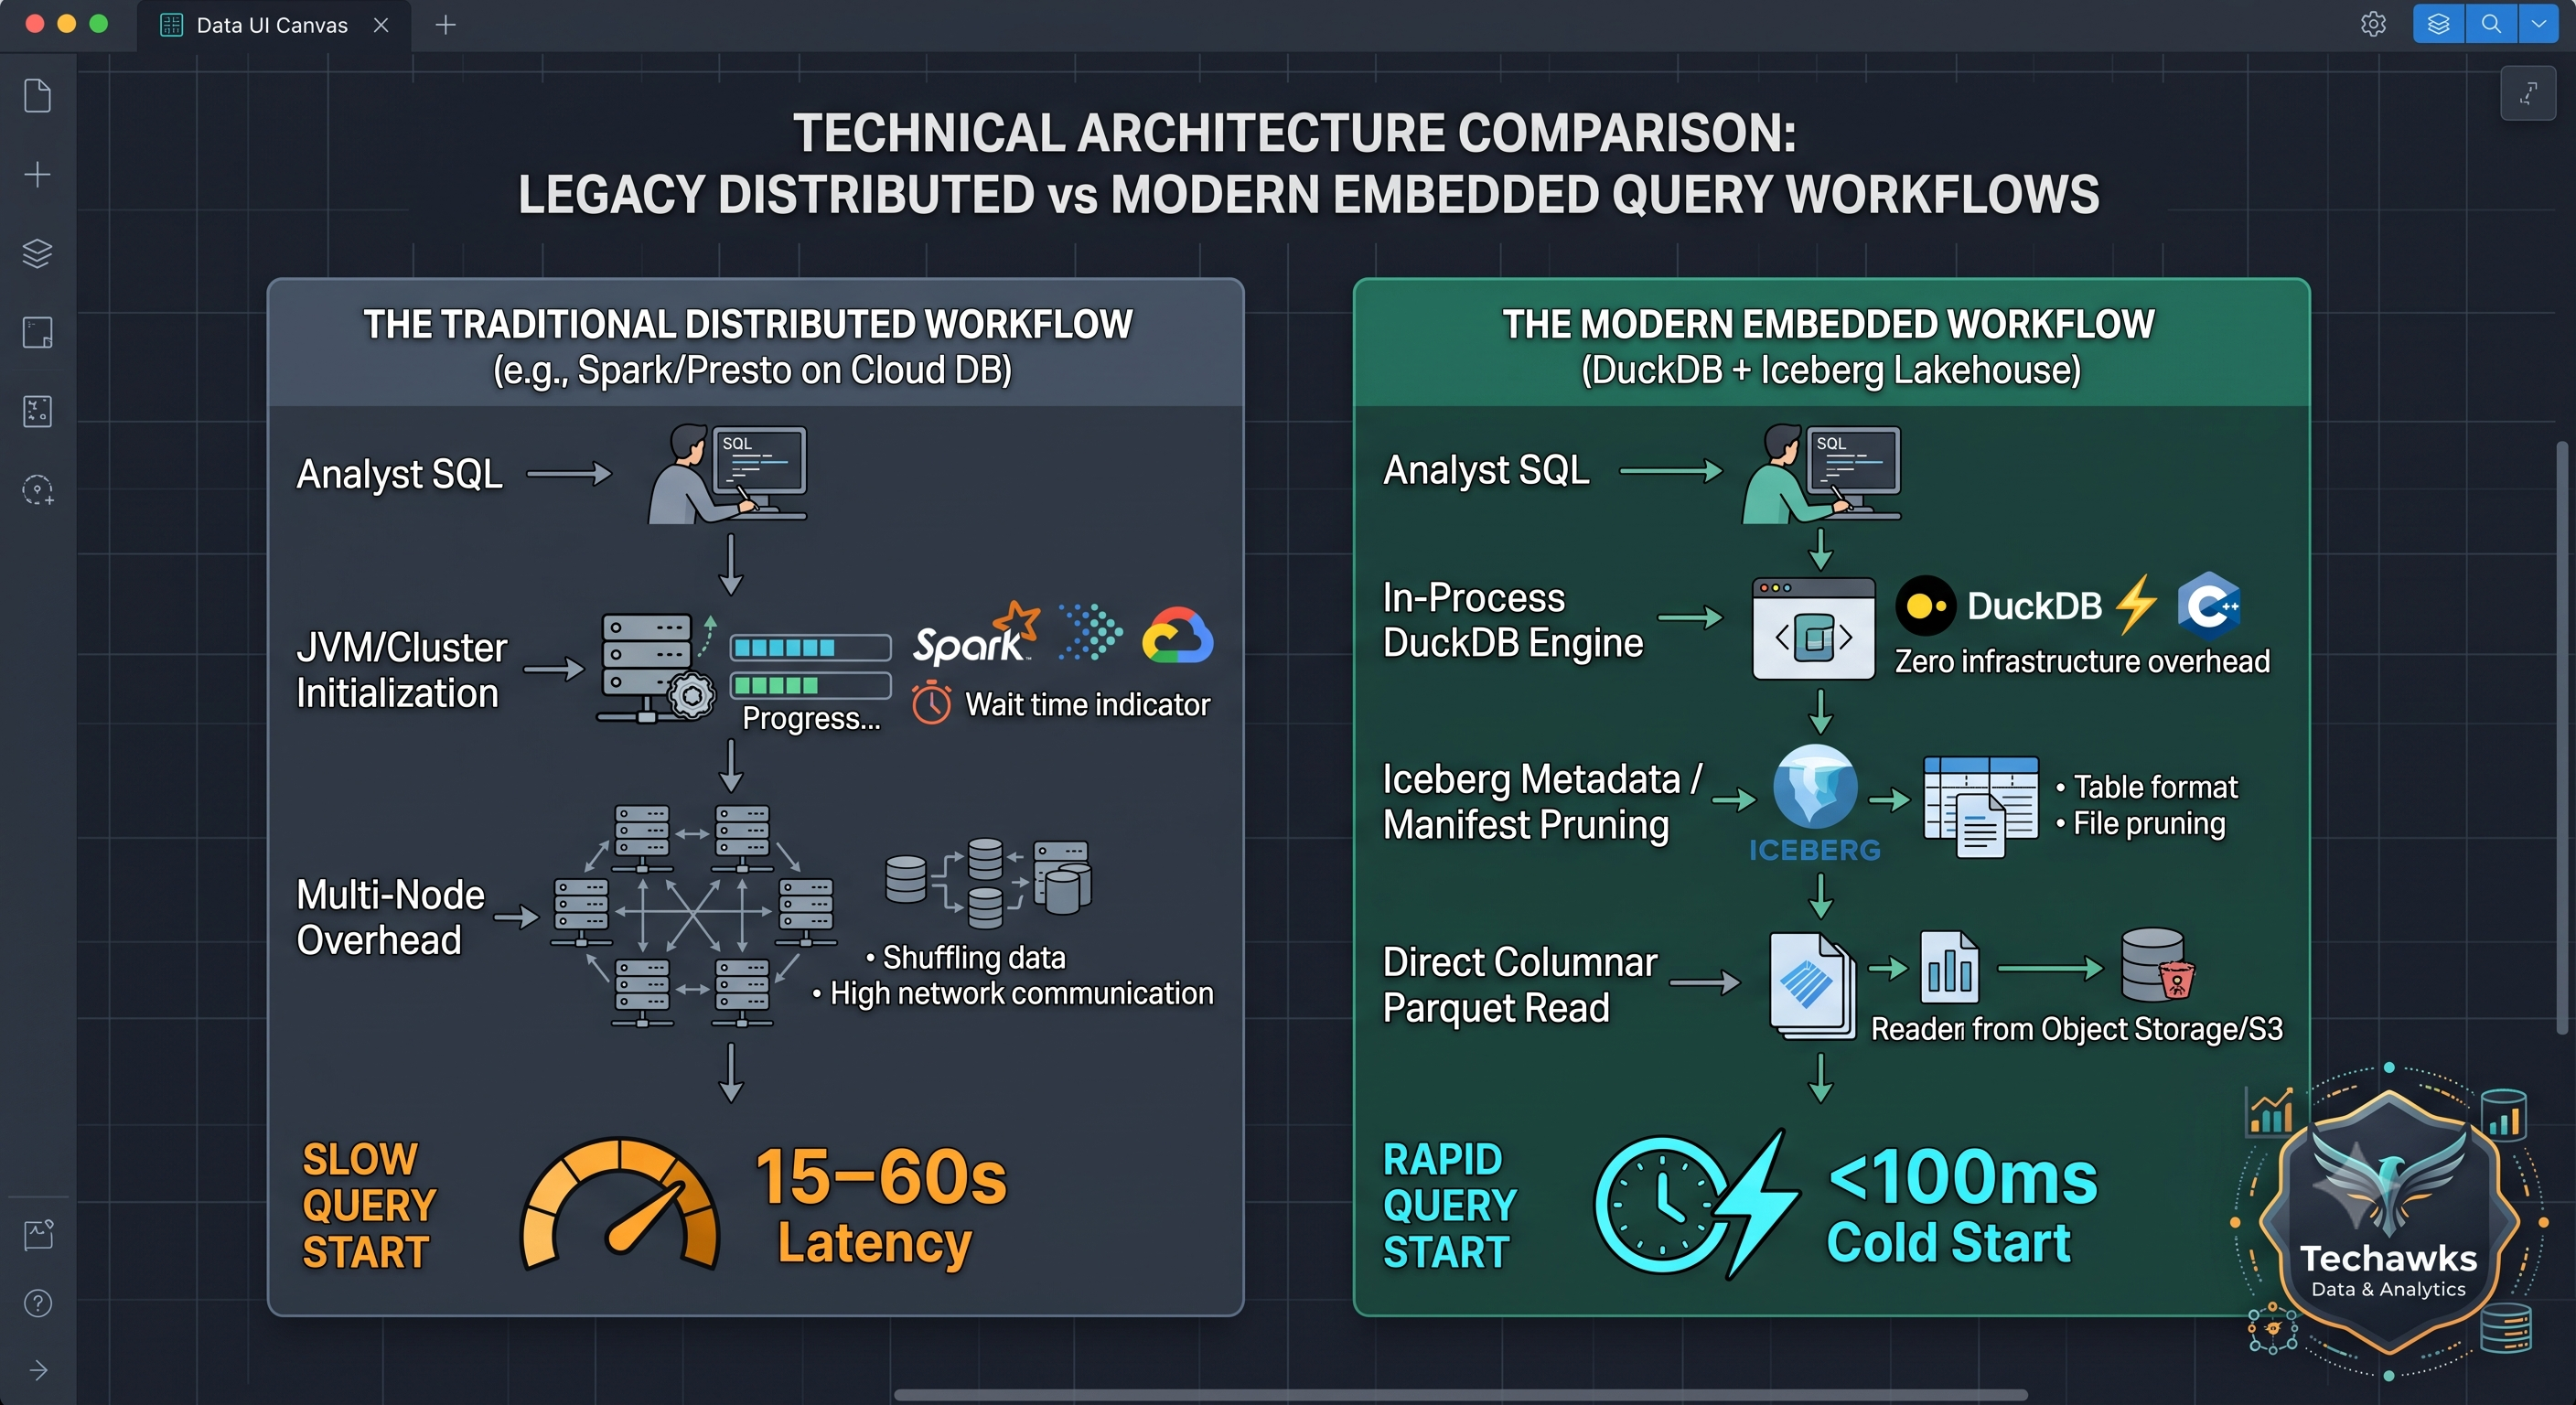
    For years, querying Apache Iceberg tables required heavy JVM-based compute engines—such as Apache Spark, Trino, or managed warehouse warehouses. If a data analyst or engineer simply wanted to inspect snapshots, debug null anomalies, or profile an ad-hoc partition, the friction of JVM initialization and cluster spin-up slowed down iteration cycles.
    DuckDB's native Iceberg extension changes this paradigm by reading Iceberg metadata hierarchies directly from local disk or S3-compatible cloud storage, executing vectorized SQL queries in-process in milliseconds.


    -- 1. Install & load the Iceberg extension
    INSTALL iceberg;
    LOAD iceberg;


    -- 2. Query an Iceberg snapshot directly from object storage with metadata pruning
    SELECT
    customer_region,
    COUNT(order_id) AS total_orders,
    ROUND(SUM(net_amount), 2) AS total_revenue
    FROM iceberg_scan('s3://prod-lakehouse/data/orders_table')
    WHERE order_date >= DATE '2026-08-01'
    GROUP BY customer_region;


    Why This Tool Matters for Data Teams
    File- and Row-Group Pruning: DuckDB parses the Iceberg manifest list and manifest files before touching the underlying Parquet files. It skips entire files and non-matching row groups, streaming only the necessary columnar byte vectors into memory.
    Zero JVM / Zero Cluster Overhead: Runs as an embedded, in-process engine within Python, notebooks, or CLI runtimes—eliminating executor scheduling overhead for single-machine workloads (<100GB to 1TB)
    Time Travel & Snapshot Auditing: Enables instant time travel via snapshot_id or timestamp parameters, making table auditing and regression debugging effortless without duplicating dataset copies.


    3 Practical Rules for Analytics Workflows
    Use DuckDB for Exploratory Analysis & CI/CD: Validate data pipeline outputs, schema contracts, and ingestion jobs locally using DuckDB before triggering distributed transformation pipelines.
    Push Predicates Early: Structure your queries with explicit partition and column filters so DuckDB can push predicates down directly into the Iceberg manifest reader.
    Know the Scaling Boundary: Use DuckDB for single-node ad-hoc analytics and pipeline validation; delegate multi-terabyte shuffle-heavy ETL to distributed engines like Spark or Trino.


    Discussion Question
    Are you currently running lightweight queries over your open table formats using embedded engines like DuckDB, or is your organization still routing all lakehouse queries through distributed clusters?


    CTA
    Join Data Science & Analytics in the Techawks Data & Analytics community to exchange production lakehouse patterns, SQL optimization techniques, and modern open-source data architectures.
    Tool Review: DuckDB + Apache Iceberg & The Death of the "Spark-for-Everything" Reflex For years, querying Apache Iceberg tables required heavy JVM-based compute engines—such as Apache Spark, Trino, or managed warehouse warehouses. If a data analyst or engineer simply wanted to inspect snapshots, debug null anomalies, or profile an ad-hoc partition, the friction of JVM initialization and cluster spin-up slowed down iteration cycles. DuckDB's native Iceberg extension changes this paradigm by reading Iceberg metadata hierarchies directly from local disk or S3-compatible cloud storage, executing vectorized SQL queries in-process in milliseconds. -- 1. Install & load the Iceberg extension INSTALL iceberg; LOAD iceberg; -- 2. Query an Iceberg snapshot directly from object storage with metadata pruning SELECT customer_region, COUNT(order_id) AS total_orders, ROUND(SUM(net_amount), 2) AS total_revenue FROM iceberg_scan('s3://prod-lakehouse/data/orders_table') WHERE order_date >= DATE '2026-08-01' GROUP BY customer_region; Why This Tool Matters for Data Teams File- and Row-Group Pruning: DuckDB parses the Iceberg manifest list and manifest files before touching the underlying Parquet files. It skips entire files and non-matching row groups, streaming only the necessary columnar byte vectors into memory. Zero JVM / Zero Cluster Overhead: Runs as an embedded, in-process engine within Python, notebooks, or CLI runtimes—eliminating executor scheduling overhead for single-machine workloads (<100GB to 1TB) Time Travel & Snapshot Auditing: Enables instant time travel via snapshot_id or timestamp parameters, making table auditing and regression debugging effortless without duplicating dataset copies. 3 Practical Rules for Analytics Workflows Use DuckDB for Exploratory Analysis & CI/CD: Validate data pipeline outputs, schema contracts, and ingestion jobs locally using DuckDB before triggering distributed transformation pipelines. Push Predicates Early: Structure your queries with explicit partition and column filters so DuckDB can push predicates down directly into the Iceberg manifest reader. Know the Scaling Boundary: Use DuckDB for single-node ad-hoc analytics and pipeline validation; delegate multi-terabyte shuffle-heavy ETL to distributed engines like Spark or Trino. Discussion Question Are you currently running lightweight queries over your open table formats using embedded engines like DuckDB, or is your organization still routing all lakehouse queries through distributed clusters? CTA Join Data Science & Analytics in the Techawks Data & Analytics community to exchange production lakehouse patterns, SQL optimization techniques, and modern open-source data architectures.
    0 Commentarios 0 Acciones 98 Views 0 Vista previa
Resultados de la búsqueda